OVERVIEW
- Real gross domestic product (GDP) state increased in 48 states and the District of Columbia in the first quarter of 2018, according to statistics on the geographic breakout of GDP released by the U.S. Bureau of Economic Analysis.
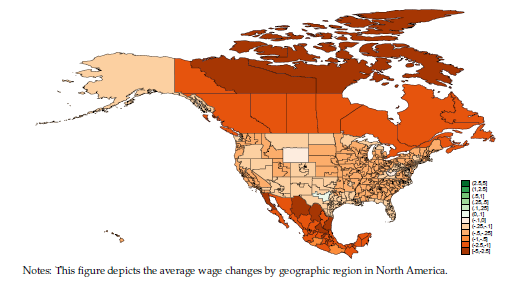
- Real GDP by state growth in the first quarter ranged from 3.6 percent in Washington to -0.6 in North Dakota. See Chart 1 from the BEA.
- The Massachusetts economy grew by 1.5 percent in the first quarter of 2018. This was below the 1.8 national average of all states and the District of Columbia. It ranked 29th in first quarter growth, nationally.
- As a region, the six states of New England grew by 1.5 percent, less than the average of all states (1.8 percent). The Southwest — Texas, New Mexico, Arizona and Oklahoma — grew the largest for Qtr1-2018 at 2.7 as did the Rocky Mountain region --Colorado, Idaho, Montana, Utah and Wyoming.
- The current dollar size of the Massachusetts GDP by State is $542.2 billion and contributes 2.7 percent of the nation’s GDP.
- Durable Goods Manufacturing increased 3.2 percent nationally. This is the eighth consecutive quarter of growth for the sector. In Massachusetts, Durable and Non-durable Goods manufacturing contributed 0.17 and 0.13 percentage points to the change in GDP-S, respectively.

ANALYSIS
Gross Domestic Product State (GDP-S) is the market value of goods and services produced by labor and property (or capital) in a state. The sum of GDP for all states released this week (1.8 percent for Qtr1-2018) differs from the headline number for national GDP (Qtr1-2018: 2.0 percent) since outputs like military and overseas activity can’t be attributed to any one state.
Real Estate and Rental and Leasing along with Information sectors were the leading contributors to the increase in real GDP nationally.
In Massachusetts, Real Estate and Rental and Leasing; Information and Professional, Scientific, & Technical Services were the major contributors to the 1.5 percent growth in Qtr1-2018. (See Table 1 p. 2.) Of these sectors, only the Information sector lost jobs (down 1,100) over a year ago. Meanwhile, Real Estate, Rental and Leasing and Professional Services added, 2,200 and 26,700 new jobs, respectively.
Thus far, the state’s economy has lagged the 2.6 percent change in growth it saw for 2017. Last year, the state experienced two stellar quarters of growth Qtr1-2017 at 5.1 and Qtr3-2017 at 5.2.
In the most recent survey, Massachusetts growth lags expansions in other high technology states. How do other high-tech states compare with Massachusetts? The state of Washington grew by 3.6 percent the fastest in the nation, Virginia by 2.4 percent while the Utah economy grew by 3.2 percent. Meanwhile, California slowed to 1.5 percent, Colorado by 3.0 percent; North Carolina grew by 2.1 percent as Minnesota expanded by 1.6 percent.