Showing posts with label #EastBostonEconomics. Show all posts
Showing posts with label #EastBostonEconomics. Show all posts
Thursday, September 12, 2019
Saturday, November 24, 2018
Under construction: Local economy East Boston, Ward 1-Boston, 02128
BUSINESS DEVELOPMENT
#DBA New Certificates issued
10 for November 2017
EMPLOYMENT DATA
State Unemployment Rate (MA)
3.7% October 2017
U.S. Unemployment Rate
4.1% October 2017
Metro Boston Unemployment Rate*
3.3% September 2017
State and Area Employment (000s)
3,643 October 2017
Jobs Added MA YoY
69,000 October 2017
Suffolk County Unemployment# & Rate 13,410; 3.1% October 17 NSA
Boston Unemployment Rates
3.1% October 2016
U.S Productivity: 3.0% 3rd Qtr. 2017 est.
Suffolk County Avg. Wkly Wage
$2,016 (1st Qtr 2017)
Occupational Employment and Wage Estimates (Boston Metro 5/2016)
$32.66 (avg. hr)
$67,930 (avg. annual salary.)
HOUSING
Housing Permits (MA): 1568
October 2017
Massachusetts Homeownership Rate
59.7% (2016)
Change in FHFA State House Price Indexes
(Seasonally Adjusted, Purchase-Only Index, 2017Q2:1.96)
CONSUMER
U.S. CPI-U, All items, 12-month % change*
0.1% (10/2017 over 10/2016) All Items YoY: +2.0%
Boston Metro Consumer Price Index
2.7% (9/2017 over 9/2016)
ENERGY
Boston Average Price - Gasoline, Unleaded Reg., Per Gallon/ 2.560 October 2017
Massachusetts Average Price Heating Oil
$2.877 per gallon 11/27/17 (excl. taxes)
Stock Market: Local:
East Boston Savings Bank Stock Latest
Bloomberg MA Stock Index (BCMAX:IND)
Saturday, November 17, 2018
The Massachusetts Employment Situation: U-Rate 3.5%; Jobs 4,400; 64,400 YoY
OVERVIEW
- According
to the Executive Office of Labor and Workforce Development, the state’s
total unemployment rate dropped one-tenth of a percentage point to 3.5 percent
in October.
- According to the federal
Bureau of Labor Statistics, the state also added 4,400 jobs in October.
- The state’s unemployment rate was two-tenths of
a percentage point lower than the national average of 3.7 percent.
- The state’s Labor Force Participation Rate (LFP)
continued to improve since October 2017. It now stands at 68.0 percent, an
increase of 2.6 percentage points. October estimates show 3.69 million
residents were employed in Massachusetts.
- The largest private sector percentage job gains over the past year took place in the
Construction (+5.4); Professional, Scientific and Business Services (+5.1);
Information (+2.0); and Education and Health Services (+1.9).
- Meanwhile, Financial Activities; Leisure and Hospitality each lost 400 jobs while Government lost 300 jobs.
ANALYSIS
The Massachusetts economy steamrolls ahead. By adding 4,400 jobs, the state’s economy showed no signs of slowing down.
"The Massachusetts unemployment rate continues to remain low at 3.5 percent and has now held below 4 percent for 30 consecutive months. With the Commonwealth's consistently low rate of unemployment, the economy continues to add jobs at a healthy clip and our labor force continues to grow to meet employment needs," Labor and Workforce Development Secretary Rosalin Acosta said.
The job market is so attractive that the October labor force increased by 10,800. Employers are competing for talent.
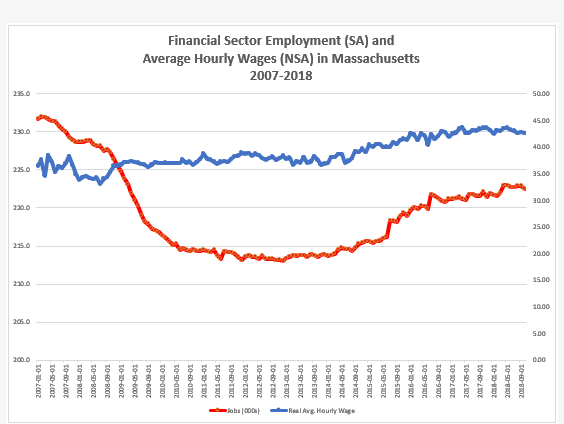
Consolidation in the state’s financial sector has been gradual. The state’s financial sector has not appreciably grown as the economy recovered from the Great Recession.
In February 2007, 10 months before the recession began, the sector employed 232,000 workers; today it employs 222,000 workers on a seasonally adjusted basis.
However, wages in the sector have increased in real terms. The average hourly wage for financial workers in January 2007 was $36.45 compared to today’s average hourly wage of $42.55. The ascent in wages picked up slightly in July 2007 as jobs in the sector began to recover.
As defined by the BLS, the financial sector classification includes finance, insurance, real estate, rental and leasing subsectors.
Friday, January 19, 2018
Research Note on the December 2017 Massachusetts Employment Situation
December 2017 Report: U-Rate: 3.5%; Jobs: 63,000 YoY
OVERVIEW
- According to the Executive Office of Labor and Workforce Development, the state’s total unemployment rate dropped to 3.5 percent in December from 3.6 percent in November.
- The state lost 500 jobs in the month.
- The state's labor force participation decreased one-tenth of a percentage point to 65.3 percent over the month. Compared to December 2016, the LFP rate over the year has increased by 0.7 percentage point.
- Construction gained 1,600 (+1.0%) jobs over the month and Manufacturing added 800 (+0.3%) jobs; Leisure and Hospitality gained 500 jobs (+0.1%); Financial Activities added 400 (+0.2%) jobs.
- Professional, Scientific and Business Services lost 1,000 (-0.2%) while Education and Health Services lost 1,000 (-0.1%)
- Other Services lost 200 (-0.1%) jobs over the month; Trade, Transportation and Utilities lost 500 (-0.1%) and Information lost 700 (-0.8%) and Government lost 100 jobs.
- The November jobs number was revised from the originally reported 6,700 to 7,800 jobs.
ANALYSIS
The December unemployment rate was six-tenths of a percentage point lower than the national rate of 4.1 percent reported by the Bureau of Labor Statistics. The largest private sector percentage job gains over the year were in Construction, Manufacturing, Financial Activities and Leisure and Hospitality.
“While much of these [year over year] job gains continue to be in sectors like Professional, Business, and Scientific Services, Manufacturing posted a preliminary 2,800 over the year job gain, the first over the year over job gain in that sector in 18 years," Labor and Workforce Development Secretary Rosalin Acosta said in yesterday's statement.
Over the last decade, Manufacturing has lost 43,100 jobs. (See table.) However, if we were to rank wages in the sectors with employment growth sectors such as Management and Professional Services, we find that manufacturing wages would rank 3rd (with $1,625 per week) and significantly higher than the private sector average of $1,273.
The state’s high-tech manufacturing may account for the high wages in an overall shrinking sector — highlighting how output increases with fewer workers. Weekly wages in the management subsector are nearly double when compared to all private industries.

Thursday, December 7, 2017
Wednesday, November 15, 2017

Monday, November 13, 2017
When it comes to business data, is Yelp as good as the U.S. Census?
From the paper titled, "Nowcasting the Local Economy: Using Yelp Data to Measure Economic Activity," by Edward L. Glaeser, Hyunjin Kim and Michael Luca
Here's the abstract from NBER.
Abstract:
Here's the abstract from NBER.
Abstract:
Can new data sources from online platforms help to measure local economic activity? Government datasets from agencies such as the U.S. Census Bureau provide the standard measures of local economic activity at the local level. However, these statistics typically appear only after multi-year lags, and the public-facing versions are aggregated to the county or ZIP code level. In contrast, crowdsourced data from online platforms such as Yelp are often contemporaneous and geographically finer than official government statistics. In this paper, we present evidence that Yelp data can complement government surveys by measuring economic activity in close to real time, at a granular level, and at almost any geographic scale. Changes in the number of businesses and restaurants reviewed on Yelp can predict changes in the number of overall establishments and restaurants in County Business Patterns. An algorithm using contemporaneous and lagged Yelp data can explain 29.2 percent of the residual variance after accounting for lagged CBP data, in a testing sample not used to generate the algorithm. The algorithm is more accurate for denser, wealthier, and more educated ZIP codes.
Thursday, October 19, 2017
A one-year look at where the jobs are in Massachusetts
The state's total unemployment rate dropped to 3.9 percent in September from 4.2 percent according to the Executive Office of Labor and Workforce Development. From September 2016 to September 2017, BLS estimates Massachusetts has added 62,300 jobs.
Job growth was strong in the state's Health Care and Education and Professional Services supersectors. Specifically, the Health Care and Social Assistance subsector added 20,600 jobs since September 2016 with Professional, Scientific and Technical Services adding 8,500. Meanwhile, Construction added 6,200 jobs.

Job growth was strong in the state's Health Care and Education and Professional Services supersectors. Specifically, the Health Care and Social Assistance subsector added 20,600 jobs since September 2016 with Professional, Scientific and Technical Services adding 8,500. Meanwhile, Construction added 6,200 jobs.

Chart by East Boston Economics
Friday, July 21, 2017
MA Employment Situation: Urate: 4.3 percent -- 10,000 jobs added in June
OVERVIEW
ANALYSIS
"During the first six months of 2017, Massachusetts has experienced the largest increase in the labor force on record, and the 66.7 labor force participation rate is now 3.9 points higher than the U.S. rate. These marked labor force gains should help ease labor market pressures and are signs of a growing economy in the Commonwealth," Labor and Workforce Development Secretary Rosalin Acosta said upon yesterday’s release.
The increase in the unemployment rate is due to the fact more workers are rejoining the labor force. The LWD office says that 121,400 workers re-entered the market from June 2016. Only construction and professional services lost jobs over the month. But all other sectors posted strong growth with education and health services leading the way.
Government continues to grow employment rising by 1.2 percent over the past year.
The growth in Massachusetts jobs should ensure that state income tax revenues grow, thus alleviating some of the sales tax revenue drift.
The often-neglected “Other Services” category continues to move with Professional, Scientific and Business Services as a percentage of total nonfarm employment, roughly 4 percent and 15 percent respectively.
- The state’s total unemployment rate increased to 4.3 percent in June from the May rate of 4.2 percent according to the Executive Office of Labor and Workforce Development.
- Preliminary estimates suggest that Massachusetts added 10,000 jobs in June. Since last June the economy has added 65,900 jobs.
- The labor force participation rate (LFP) remained at 66.7 percent over the month; however, this represents a 1.8 percent increase from June 2016.
- Education and Health Services added 6,700 jobs over the month. Over the year, Education and Health Services gained 28,200 jobs.
- Information added 200 jobs over the month; over the year, this sector gained 1,300 jobs.
- Federal, state and local government combined gained 400 jobs (5,500 over the past 12 months).
- Professional, Scientific, Business Service subsector lost 2,200 jobs bringing year over year to 13,900.
- Construction lost 2,800 jobs in June but since last year the sector has added 1,800 jobs.
- In June, the manufacturing sector gained 500 jobs but posted a 12-month loss of 1,400 jobs.
- The May estimate was revised with a gain of 2,000 jobs as opposed to the 2,900 originally reported.
ANALYSIS
"During the first six months of 2017, Massachusetts has experienced the largest increase in the labor force on record, and the 66.7 labor force participation rate is now 3.9 points higher than the U.S. rate. These marked labor force gains should help ease labor market pressures and are signs of a growing economy in the Commonwealth," Labor and Workforce Development Secretary Rosalin Acosta said upon yesterday’s release.
The increase in the unemployment rate is due to the fact more workers are rejoining the labor force. The LWD office says that 121,400 workers re-entered the market from June 2016. Only construction and professional services lost jobs over the month. But all other sectors posted strong growth with education and health services leading the way.
Government continues to grow employment rising by 1.2 percent over the past year.
The growth in Massachusetts jobs should ensure that state income tax revenues grow, thus alleviating some of the sales tax revenue drift.
The often-neglected “Other Services” category continues to move with Professional, Scientific and Business Services as a percentage of total nonfarm employment, roughly 4 percent and 15 percent respectively.
Both are strongly correlated. The Bureau of Labor Statistics defines “Other Services” as those jobs (except for Public Administration) that provide services such as machine repair, administering religious services, grantmaking, personal and pet care services as well as other establishments. Sector growth since the last recession has been mostly flat at 0.22 percent since 2007.

Friday, June 16, 2017
Conte at NewBostonPost.com: Millennials Like the Hub, But Can They Afford To Live Here?
Call it the latest attempt to bridge the knowledge gap in Boston between aging Baby Boomers and the Millennials. The eminent Boston Foundation, a century-old, well-endowed charity that doubles as a think tank, is talking a lot more to the next generation as it prompts the city’s civic leaders to hand over the reins to Boston’s millennials.
“The baby boomers have been late in turning their attention to the millennials,” said Paul Grogan, foundation president, last month. “We still think we are young.” Read more at NewBostonPost.com.
“The baby boomers have been late in turning their attention to the millennials,” said Paul Grogan, foundation president, last month. “We still think we are young.” Read more at NewBostonPost.com.
Saturday, May 13, 2017

Thursday, April 27, 2017
Scott Sumner: We don't need steel tariffs for national security
Reprinted from the Foundation for Economic Education
We Don't Need Steel Tariffs for National Security
The Financial Times reports that the Trump administration is considering steel tariffs:The US has set the stage for a global showdown over steel, launching a national security investigation that could lead to sweeping tariffs on steel imports in what would be the first significant act of economic protectionism by President Donald Trump.A few observations:
The decision to use a 1962 law allowing the US government to limit imports that threaten its security readiness is intended to deliver on Mr Trump's campaign promises to bolster heavy industry and "put new American steel into the spine of this country", officials said on Thursday.
1. Congress erred in delegating to the executive branch the power to set national security tariffs. Almost any industry could be deemed essential for "national security."
2. The US steel industry currently produces about 80 million tons per year. That's more than enough to meet our essential military needs. And this doesn't even account for the fact that steel production could be increased, as we are not operating at capacity. Yes, it might take a bit of time to bring mothballed plants back online, but as the following quotation suggests, new weapons now take far longer to develop than they did back in WWII:
Civilian manufacturing capacity is now ALMOST ENTIRELY USELESS for defense purposes. Whereas in WWII, auto assembly lines could be used to make planes & tanks, and Singer made guns instead of sewing machines... Now all but the most basic defense products (personal firearms, sewing of uniforms, etc) must be made by specialized expert-firms. Super-weapons such as the F-22/F-35, M1A3 Abrams (it's under development now), and whatever we make when we finally field a next-generation artillery piece (cancelling the Crusader was a mistake, btw) require such a specialized knowledge-base & facilities, that they MUST be made by a dedicated defense industry - something we have (on a best-in-the-world level). Re-purposing a factory that built 2-ton SUVs to build 70-ton tanks just isn't happening. Even if it could, how much experience does your average auto-worker have in assembling uranium-ceramic-steel-composite armor properly, so as to maintain it's ability to take 125mm KE hits?And this doesn't even account for the fact that the US would likely have access to steel produced in friendly countries such as Canada, Mexico, Brazil, Japan and Germany. Sure, one could construct scenarios where some of that steel is cut off in a war (i.e., Japanese exports are disrupted by a war with China, or German exports in a war with Russia), but unless the US is fighting the entire world at once, we'd surely have access to at least some markets. And if steel imports really were cut off, where would we get our iron ore? Today we don't need much iron because of our use of scrap metal. But if we stopped building cars during a war, then far less scrap metal would be available. This also fails to account for the fact that warfare in the modern world tends to be asymmetric. The threat of nuclear annihilation means that we fight small countries, not large nuclear powers.
A final point on this issue, is that modern war moves too fast to 'develop and manufacture new products after the fact, using civilian industries'. It's a 'run what ya brung' sort of affair
The development of missile technology tends to make steel-intensive weapons (such as ships and tanks) more of a "sitting duck" than in the old days. I recall that a single Argentine missile took out a British destroyer in the Falklands War--and that was way back in 1983. Think about today's cruise missiles, and also consider that the sort of powerful adversary that would require the US to have a massive steel industry would be far more militarily advanced than Argentina in 1983. I'm not expert on modern weapons, but I'd wager that in today's warfare a big steel industry is less important than back in WWII.
If steel prices rise, other American manufacturers (cars, white goods, etc.) would be put at a competitive disadvantage to imports.
3. One possibility is that the national security argument is simply being used as an excuse to save jobs in the steel industry. As an analogy, recall that when Trump campaigned for President he promised to ban Muslim immigration. When Rudy Giuliani told him that this was a legally dubious proposal, Trump asked for a version of the plan that would be accepted by the courts. This led to the recent dispute over the ban on immigration from seven (later six) majority Muslim countries.
I don't have strong views either way on whether Trump's immigration ban was legal. But I will say that the legal argument for protecting the US steel industry on national security grounds seems far less plausible than the claim that the immigration ban protects national security (and I'm dubious of even that claim.) So you might expect the courts to question the steel tariffs on exactly the same grounds they challenged the immigration ban---Trump is on the record favoring this sort of action on entirely different grounds---jobs. On the other hand, courts have tended to show more deference to the government on economic regulation than on civil rights/equal protection issues, so I'm not making any predictions here.
4. It is likely that a suitably high steel tariff could save some jobs in the US steel industry. However, it seems much less likely that this would serve Trump's broader goals of restoring jobs in manufacturing. Tariffs protect industries by driving up the price of the commodity being imported. But if steel prices rise, then this puts other American manufacturers (cars, white goods, etc.) at a competitive disadvantage to imports. Mexican firms making cars or washing machines would be able to buy steel more cheaply than American manufacturers, and this would cost jobs in other sectors of the US economy. The net effect on the total number of jobs in manufacturing is likely to be pretty trivial, and could be either positive or negative.
5. Policies based on metaphors that romanticize and/or anthropomorphize the economy are unlikely to be wise:
The decision to use a 1962 law allowing the US government to limit imports that threaten its security readiness is intended to deliver on Mr Trump's campaign promises to bolster heavy industry and "put new American steel into the spine of this country", officials said on Thursday.Sorry folks, those days are long gone.

Scott Sumner
Scott B. Sumner is the director of the Program on Monetary Policy at the Mercatus Center and a professor at Bentley University. He blogs at the Money Illusion and Econlog.
This article was originally published on FEE.org. Read the original article.
Republished from EconLog.
Republished from EconLog.
Subscribe to:
Posts (Atom)