Showing posts with label Bureau of Labor Statistics. Show all posts

Monday, July 8, 2019

New NBER Working Paper: Improving the accuracy of economic measurement with multiple data sources: The case of payroll employment data

A new NBER Working Paper, "Improving the accuracy of economic measurement with multiple data sources: The case of payroll employment data," by Cajner, Crane, Decker, Hamins-Puertolas, and Kurz.

Abstract:
This paper combines information from two sources of U.S. private payroll employment to increase the accuracy of real-time measurement of the labor market. The sources are the Current Employment Statistics (CES) from BLS and microdata from the payroll processing firm ADP. We briefly describe the ADP-derived data series, compare it to the BLS data, and describe an exercise that benchmarks the data series to an employment census. The CES and the ADP employment data are each derived from roughly equal-sized samples. We argue that combining CES and ADP data series reduces the measurement error inherent in both data sources. In particular, we infer “true” unobserved payroll employment growth using a state-space model and find that the optimal predictor of the unobserved state puts approximately equal weight on theCES and ADP-derived series. Moreover, the estimated state contains information about future readings of payroll employment.
Available at NBER

Friday, May 3, 2019

Note on the April 2019 U.S. Employment Situation: U-Rate 3.6%; Jobs +263,000

OVERVIEW
  • Total non-farm payroll employment increased by 263,000 and the unemployment rate declined to 3.6 percent, moving down 0.2 percentage point from the previous month according to the Bureau of Labor Statistics.  
  • The Labor Force Participation (LFP) rate declined by 0.2 percentage point to 62.8 percent. Nonetheless, the rate was unchanged from a year ago. The Employment-Population ratio also remained at 60.6 percent. Since October 2018, the rate has been either 60.6 percent or 60.7 percent. 
  • Professional and Business Services (+76,000) and Construction (+33,000) led all sectors in the April payrolls. Employment in Health Care (+27,000) did not finish in the top two sectors for growth but along with Professional Services (+535,000) added the most jobs over the past year with Health Care adding +404,000 jobs.
  • With gains in nonresidential specialty trade contractors and in heavy and civil engineering, Construction has added 33,000 jobs. For the year, the sector has added 22,000 jobs. 
  • Manufacturing sector employment (+4,000) changed little for the third month in a row. In the 12 months prior to February 2019 the industry added on average 22,000 jobs per month. 
  • Average hourly earnings rose by 6 cents to $27.77. In April, average workweek for all employees decreased by 0.1 hour to 34.4 hours matching the rate for February 2019.  
  • The number of persons employed part-time held was unchanged at 4.7 million in April. The number of long-termed unemployed (greater than 27 weeks) remained unchanged at 1.2 million and remained to account for 21.1 percent of all unemployed. 
  • The following sectors saw little or no change in employment:  Mining, Wholesale Trade, Transportation and Warehousing, Information, Leisure and Hospitality, and Government.


ANALYSIS

This month’s report is a rebounding blockbuster, considering two months ago the U.S. stock market and policy makers were stunned by the creation of only 56,000 jobs. (The original number was 33,000).  

Wall Street estimated the April payrolls number at 185,000 jobs.  Earlier in the week, the ADP National Employment Report,  estimated the creation of 275,000 new private sector jobs; the BLS reported private sector job creation at 236,000 jobs. 

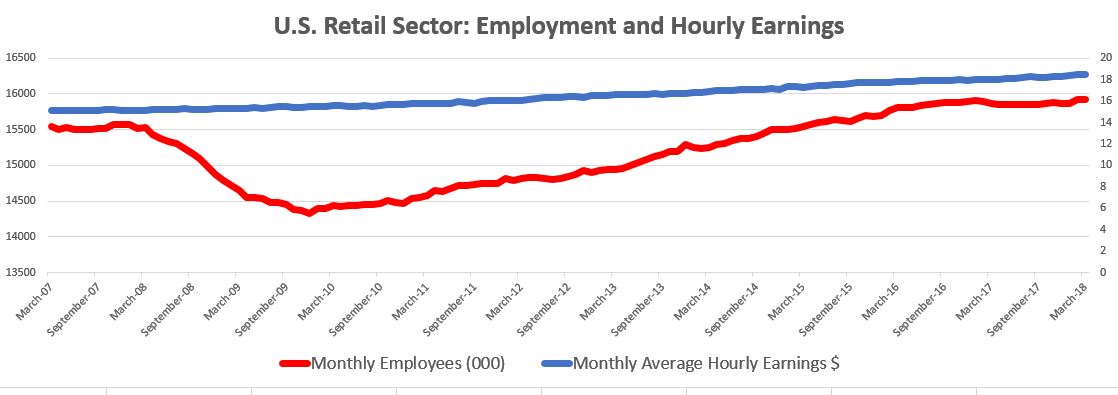
Retail trade changed little in April; the sector was down 12,000 jobs but the motor vehicle and parts dealers subsector added 8,000 jobs. General merchandise stores suffered a loss of 9,000 jobs. 

Revisions to previous reports were mixed. The February payrolls number was revised upward to 56,000 from 33,000 and the March number was revised down from 196,000 to 189,000. Still the revisions identified 16,000 more jobs than previously reported.  The three-month moving average settled at 169,000 per month. Similar revisions from the earlier three months resulted in a three-month average of 180,000. 

The unemployment rate of 3.6 percent is the lowest since 1969

The current economy, based on supply-side reforms, is benefiting workers and instilling confidence in consumers. Not so long ago, market watchers were worried about the slowdown in consumer spending as a bellwether of an almost certain downturn. 

On Thursday, the BLS reported than nonfarm business sector labor productivity increased 3.6 percent in the first quarter of 2019, with output increasing by 4.1 percent and hours worked increased 0.5 percent. Along with productivity (another blow-out number), the job market is at a sweet spot. 

Today’s report noted that average hourly earnings over the past year have increased by 3.2 percent.  Workers and consumers are more careful about how they treat homeowner equity which is 16 percent higher than 2006, the advent of the Great Recession. Apparently increased wages serve as a bulwark against reckless home equity borrowing. 

As a result, workers are saving more. The article to read is “Why Are Americans Suddenly Saving?” by Matthew C. Klein in Barron’s on April 22, 2019.


Source: Author’s calculations based on BLS and US Census historical data (Total Retail Sales)


Conte Consulting:  Editorial Services | Web Content Design & Management |Public Policy Analysis

Friday, July 6, 2018

June 2018 Employment Situation: U-Rate: 4.0%; Jobs: +213,000

OVERVIEW

  • The unemployment rate rose to 4.0 percent in June with payrolls expanding by 213,000 jobs, according to the Bureau of Labor Statistics.
  • The Labor Force Participation (LFP) edged up by 0.2 percentage point to 62.9 percent. The employment-population ratio was unchanged in June at 60.4 percent and has remained flat since February. The number of unemployed for the month of June was 6.6 million. One year ago, that number was 7.0 million. 
  • In June employment grew in the manufacturing, health care, construction and mining sectors.
  • Manufacturing added 36,000 jobs with durable goods manufacturing accounting for most of the increase. 
  • Professional and business services added 50,000 jobs. This sector has added 521,000 jobs over the past year. Retail lost 22,000 jobs in June offsetting May’s gain of 25,000 jobs. 
  • Employment in the other major sectors—wholesale trade, transportation and warehousing, information, financial activities, leisure and hospitality and government —changed little over the month.
  • The average duration of unemployment declined over the past year from 24.9 to 21.2 weeks.

ANALYSIS

The U.S. economy added 213,000 jobs beating economists’ expectations in the range of 200,000 and 195,000 jobs. 

The report looks even better when considering the revisions. April’s report was revised upward to 175,000 jobs from the previously reported 159,000 and May’s report was revised upward to 244,000 from 223,000. The BLS reported that after these revisions, job gains have averaged 211,000 per month over the last three months. 

The private sector created 202,000 new jobs, a figure higher than this week’s ADP report for the same month (+177,000). 

The unemployment rate rose to 4.0 percent from 3.8 percent but remains lower than 12 month ago (4.3 percent). The increase may be attributable to the 0.2 percentage point increase in labor force participation over the past month. 

Over the past year the manufacturing sector has added 285,000 jobs, an impressive number that will be tested as trade disputes intensify with new tariffs on foreign goods. 

Average hourly earnings for all employees rose by five cents to $26.98, representing a gain of 2.7 percent over the past year. The average work week remained at 34.5 hours. 

The number of long-term unemployment increased by 289,000 to 1.5 million. These individuals who have been unemployed for more than 27 weeks account for 23 percent of all unemployed. The percent distribution of this group has increased over the past five months suggesting the hardships of returning to work after long periods of unemployment.


Friday, April 6, 2018

March 2018 U.S. Employment Situation -- U-rate, 4.1 percent; Payrolls +103.000

OVERVIEW

  • The unemployment rate remained at 4.1 percent for the sixth consecutive month in March with payrolls expanding by 103,000 jobs, according to the Bureau of Labor Statistics.
  • The Labor Force Participation (LFP) changed little at 62.9 percent. The employment-population ratio was unchanged at 60.4 percent.
  • In March the employment grew in the manufacturing, health care and mining sectors with the durable goods sub-sector accounting for approximately three-fourths of the gain in manufacturing. 
  • Health care added 22,000 jobs a gain consistent with the past 12-month average while construction slowed down after a February gain. 
  • Professional and business services added 33,000 jobs. This sector has added 502,000 jobs over the past year.
  • After increasing 47,000 in February, retail lost 4,000 jobs in March. 
  • Employment in the other major sectors—wholesale trade, transportation and warehousing, information, financial activities, leisure and hospitality and government —changed little over the month.
  • Average hourly earnings for all employees rose by 8 cents to $26.82, representing a gain of 2.7 percent over the past year. The average work week remained at 34.5 hours.


ANALYSIS
The March payroll jobs report could best be summed up as “less than stellar.” Economists were expecting a monthly gain of between 185,000 and 193,000 jobs. Most economists believe the U.S. economy has reached full employment with some worrying about running out of workers because of fast job growth. However, the number of involuntary part-time workers remained unchanged at 5 million while the number of marginally attached workers checked in at 1.5 million persons, a number not much different from last year. The number of part-time workers in the labor pool increased from 20.7 million in March 2017 to 21.3 million in March 2018. The retail sector returned to its current state of “disliked normalcy” with employment declining by 13,000 jobs in general merchandise stores, “offsetting a gain of the same size in February,” according to the BLS.  Earnings in this sector have bounced back a bit since a decline that began in 2016 (See chart below). The LFP rate decreased from both February 2018 (month over month) and March 2017 (year over year). Today’s report included good news. Average hourly earnings have increased by 71 cents over the past year. Paul Ashworth, chief U.S. economist at Capital Economics, told Bloomberg News that despite the weak payrolls gain, "There is still evidence of an acceleration in the underlying pace of employment growth… looking through the volatility, employment growth is trending higher and wage growth is starting to heat up.”  As a result, pressure will build on the U.S. Federal Reserve Bank to abide by its commitments to raise rates this year.


Friday, January 19, 2018

Research Note on the December 2017 Massachusetts Employment Situation


December 2017 Report: U-Rate: 3.5%; Jobs: 63,000 YoY 

OVERVIEW

  •  According to the Executive Office of Labor and Workforce Development, the state’s total unemployment rate dropped to 3.5 percent in December from 3.6 percent in November.
  • The state lost 500 jobs in the month.
  • The state's labor force participation decreased one-tenth of a percentage point to 65.3 percent over the month. Compared to December 2016, the LFP rate over the year has increased by 0.7 percentage point.
  • Construction gained 1,600 (+1.0%) jobs over the month and Manufacturing added 800 (+0.3%) jobs; Leisure and Hospitality gained 500 jobs (+0.1%); Financial Activities added 400 (+0.2%) jobs. 
  • Professional, Scientific and Business Services lost 1,000 (-0.2%) while Education and Health Services lost 1,000 (-0.1%)  
  • Other Services lost 200 (-0.1%) jobs over the month; Trade, Transportation and Utilities lost 500 (-0.1%) and Information lost 700 (-0.8%) and Government lost 100 jobs. 
  • The November jobs number was revised from the originally reported 6,700 to 7,800 jobs. 

ANALYSIS

The December unemployment rate was six-tenths of a percentage point lower than the national rate of 4.1 percent reported by the Bureau of Labor Statistics. The largest private sector percentage job gains over the year were in Construction, Manufacturing, Financial Activities and Leisure and Hospitality. 

“While much of these [year over year] job gains continue to be in sectors like Professional, Business, and Scientific Services, Manufacturing posted a preliminary 2,800 over the year job gain, the first over the year over job gain in that sector in 18 years," Labor and Workforce Development Secretary Rosalin Acosta said in yesterday's statement. 

Over the last decade, Manufacturing has lost 43,100 jobs. (See table.) However, if we were to rank wages in the sectors with employment growth sectors such as Management and Professional Services, we find that manufacturing wages would rank 3rd (with $1,625 per week) and significantly higher than the private sector average of $1,273.   

The state’s high-tech manufacturing may account for the high wages in an overall shrinking sector — highlighting how output increases with fewer workers.  Weekly wages in the management subsector are nearly double when compared to all private industries. 


Tuesday, September 5, 2017

Which sectors provided the most job growth since January 2007: A 10-year look

Source: Bureau of Labor Statistics, CES Series

Last Friday, the Bureau of Labor Statistics reported the U.S. economy created 156,000 jobs in August 2017, a number below economists' consensus estimates. The unemployment rate "was little unchanged" according to the BLS, but actually ticked upward to 4.4 percent. Major job gains emerged in manufacturing, construction, professional and technical services, health care and mining. How have these sectors fared since the peak before the Great Recession, which began in December 2007 and ended in June 2009? How does Friday's snapshot relate to longer term trends? 

The decline in manufacturing jobs in the United States has trended downward over the decades. Few workers are producing more output. The interesting takeaway from this chart is the decline in construction jobs. Despite the uptick in the economy, construction jobs are down 800,000 since January 2007.  The high-paying education and health services and professional the business services added more than two-thirds of the decade long gain to total non-farm employment. Less impressive is the gain in the generally lower paid professions of leisure and hospitality which added 2.6 million since January 2007. 

Friday, July 21, 2017

MA Employment Situation: Urate: 4.3 percent -- 10,000 jobs added in June

OVERVIEW

  • The state’s total unemployment rate increased to 4.3 percent in June from the May rate of 4.2 percent according to the Executive Office of Labor and Workforce Development.
  • Preliminary estimates suggest that Massachusetts added 10,000 jobs in June.  Since last June the economy has added 65,900 jobs.
  • The labor force participation rate (LFP) remained at 66.7 percent over the month; however, this represents a 1.8 percent increase from June 2016.
  • Education and Health Services added 6,700 jobs over the month. Over the year, Education and Health Services gained 28,200 jobs.
  • Information added 200 jobs over the month; over the year, this sector gained 1,300 jobs.
  • Federal, state and local government combined gained 400 jobs (5,500 over the past 12 months).
  • Professional, Scientific, Business Service subsector lost 2,200 jobs bringing year over year to 13,900.
  • Construction lost 2,800 jobs in June but since last year the sector has added 1,800 jobs.
  • In June, the manufacturing sector gained 500 jobs but posted a 12-month loss of 1,400 jobs.
  • The May estimate was revised with a gain of 2,000 jobs as opposed to the 2,900 originally reported.

ANALYSIS

 "During the first six months of 2017, Massachusetts has experienced the largest increase in the labor force on record, and the 66.7 labor force participation rate is now 3.9 points higher than the U.S. rate. These marked labor force gains should help ease labor market pressures and are signs of a growing economy in the Commonwealth," Labor and Workforce Development Secretary Rosalin Acosta said upon yesterday’s release. 

The increase in the unemployment rate is due to the fact more workers are rejoining the labor force. The LWD office says that 121,400 workers re-entered the market from June 2016.  Only construction and professional services lost jobs over the month. But all other sectors posted strong growth with education and health services leading the way. 

Government continues to grow employment rising by 1.2 percent over the past year.  

The growth in Massachusetts jobs should ensure that state income tax revenues grow, thus alleviating some of the sales tax revenue drift.  

The often-neglected “Other Services” category continues to move with Professional, Scientific and Business Services as a percentage of total nonfarm employment, roughly 4 percent and 15 percent respectively. 

Both are strongly correlated. The Bureau of Labor Statistics defines “Other Services” as those jobs (except for Public Administration) that provide services such as machine repair, administering religious services, grantmaking, personal and pet care services as well as other establishments. Sector growth since the last recession has been mostly flat at 0.22 percent since 2007.

Indicators

Test