This just in from the Executive Office of Labor and Workforce Development:
BOSTON, MA (March 13, 2020)– The state’s January total unemployment remained unchanged at 2.8 percent for the sixth consecutive month following on the Bureau of Labor Statistics’ annual revisions, the Executive Office of Labor and Workforce Development announced Friday.
The Bureau of Labor Statistics’ preliminary job estimates indicate Massachusetts added 11,800 jobs in January. Over the month, the private sector added 11,100 jobs as gains occurred in Trade, Transportation, and Utilities; Education and Health Services; Professional, Scientific, and Business Services; Financial Activities; Leisure and Hospitality; Other Services; Information; Construction; and Manufacturing.
From January 2019 to January 2020, BLS estimates Massachusetts added 33,400 jobs.
The January unemployment rate was eight-tenths of a percentage point lower than the national rate of 3.6 percent reported by the Bureau of Labor Statistics.
"Following year-end revisions, BLS now estimates Massachusetts added 33,400 jobs over the year. In addition to those job gains, the labor force increased by 27,000 from last year’s level, with 39,400 more residents employed and 12,300 fewer residents unemployed," Labor and Workforce Development Secretary Rosalin Acosta said.
The labor force increased by 1,900 from 3,834,300 in December, as 2,300 more residents were employed and 400 fewer residents were unemployed over the month.
Over the year, the state’s seasonally adjusted unemployment rate dropped three-tenths of a percentage point.
The state’s labor force participation rate – the total number of residents 16 or older who worked or were unemployed and actively sought work in the last four weeks – remained unchanged at 67.9 percent. Compared to January 2019, the labor force participation rate is up two-tenths of a percentage point.
The largest private sector percentage job gains over the year were in Information; Education and Health Services; Professional, Scientific, and Business Services; and Construction.
Annual revisions to the job estimates show growth was greater than previously published for 2018 and less in 2019. In 2018, 42,700 jobs were added over the year. In 2019, estimates indicate 26,100 jobs were added over the year. BLS annually updates job estimates for each state with the most up-to-date information supplied by employers.
Annual year-end revisions show the unemployment rates were slightly lower than the previously published estimates for August 2019 through November 2019. The labor force estimates were lower than previously published estimates for 2015 to 2019.
January 2020 Employment Overview
Trade, Transportation and Utilities added 3,400 (+0.6%) jobs over the month. Over the year, Trade, Transportation and Utilities gained 2,900 (+0.5%) jobs.
Education and Health Services added 2,000 (+0.2%) jobs over the month. Over the year, Education and Health Services gained 11,700 (+1.4%) jobs.
Professional, Scientific and Business Services added 1,600 (+0.3%) jobs over the month. Over the year, Professional, Scientific and Business Services gained 7,000 (+1.2%) jobs.
Financial Activities added 1,100 (+0.5%) jobs over the month. Over the year, Financial Activities gained 1,300 (+0.6%) jobs.
Leisure and Hospitality added 800 (+0.2%) jobs over the month. Over the year, Leisure and Hospitality gained 2,100 (+0.6%).
Other Services added 800 (+0.6%) jobs over the month. Over the year, Other Services are up 100 (+0.1%) jobs.
Information added 600 (+0.6%) jobs over the month. Over the year, Information gained 3,600 (+3.9%) jobs.
Construction added 500 (+0.3%) jobs over the month. Over the year, Construction has added 1,000 (+0.6%) jobs.
Manufacturing added 300 (+0.1%) jobs over the month. Over the year, Manufacturing lost 1,500 (-0.6%) jobs.
Government added 700 (+0.2%) jobs over the month. Over the year, Government gained 5,200 (+1.1%) jobs.
Labor Force Overview
The January estimates show 3,729,900 Massachusetts residents were employed and 106,200 were unemployed, for a total labor force of 3,836,100. The unemployment rate remained steady at 2.8 percent. The January labor force increased by 1,900 from 3,834,300 in December, as 2,300 more residents were employed and 400 fewer residents were unemployed over the month. The labor force participation rate, the share of working age population employed and unemployed, remained unchanged at 67.9 percent. The labor force was up 27,000 from the 3,809,100 January 2019 estimate, with 39,400 more residents employed and 12,300 fewer residents unemployed.
Detailed labor market information is available at www.mass.gov/lmi.
Showing posts with label #MAEconomy #MAPoli. Show all posts
Showing posts with label #MAEconomy #MAPoli. Show all posts
Friday, March 13, 2020
Wednesday, December 26, 2018
The November 2018 Employment Situation in Massachusetts
U-Rate: 3.4%; +4,600; +60,500 YoY
OVERVIEW- According to the Executive Office of Labor and Workforce Development, the state’s total unemployment rate dropped one-tenth of a percentage point to 3.4 percent in November.
- According to the federal Bureau of Labor Statistics, the state added 4,600 jobs in November.
- he state’s unemployment rate was three-tenths of a percentage point lower than the national average of 3.7 percent.
- The state’s Labor Force Participation Rate (LFP) remained at 68.0 percent. Since November 2017, the LFP rate by 2.7 percentage points.
- Trade, Transportation and Utilities added 3,100 over the month and Professional, Scientific and Business Services added 1,700 with Education and Health Services adding 1,200.
- Financial Activities lost 700 jobs over the month with Construction (-500), Other Services (-300) and Manufacturing (-100) also losing jobs in November.
- Two sectors remained unchanged over the month: Government and Leisure and Hospitality.

ANALYSIS
Since January the Massachusetts monthly unemployment rate averaged 3.5 percent. The state continues to enjoy an unemployment rate less than the national rate.
The jobs economy is driven mostly by the state’s Professional, Scientific and Business Services sector, which created 27,600 jobs since last November. However, the Leisure and Hospitality sector shed 800 jobs since that time. Financial Activities only added 700 jobs. Government has lost jobs.
Education and Health Services comprise the largest sector in Massachusetts. (See table above) Over the past 12 months it has added 14,400 jobs.
Assuming the BLS figure of 60,500 new jobs, the state created a monthly average of approximately 5,000 jobs since last November. Northern New England is benefiting from low unemployment rates.

Saturday, November 17, 2018
The Massachusetts Employment Situation: U-Rate 3.5%; Jobs 4,400; 64,400 YoY
OVERVIEW
- According
to the Executive Office of Labor and Workforce Development, the state’s
total unemployment rate dropped one-tenth of a percentage point to 3.5 percent
in October.
- According to the federal
Bureau of Labor Statistics, the state also added 4,400 jobs in October.
- The state’s unemployment rate was two-tenths of
a percentage point lower than the national average of 3.7 percent.
- The state’s Labor Force Participation Rate (LFP)
continued to improve since October 2017. It now stands at 68.0 percent, an
increase of 2.6 percentage points. October estimates show 3.69 million
residents were employed in Massachusetts.
- The largest private sector percentage job gains over the past year took place in the
Construction (+5.4); Professional, Scientific and Business Services (+5.1);
Information (+2.0); and Education and Health Services (+1.9).
- Meanwhile, Financial Activities; Leisure and Hospitality each lost 400 jobs while Government lost 300 jobs.
ANALYSIS
The Massachusetts economy steamrolls ahead. By adding 4,400 jobs, the state’s economy showed no signs of slowing down.
"The Massachusetts unemployment rate continues to remain low at 3.5 percent and has now held below 4 percent for 30 consecutive months. With the Commonwealth's consistently low rate of unemployment, the economy continues to add jobs at a healthy clip and our labor force continues to grow to meet employment needs," Labor and Workforce Development Secretary Rosalin Acosta said.
The job market is so attractive that the October labor force increased by 10,800. Employers are competing for talent.
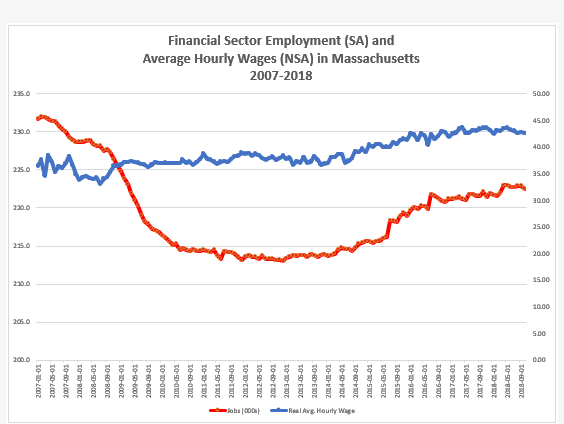
Consolidation in the state’s financial sector has been gradual. The state’s financial sector has not appreciably grown as the economy recovered from the Great Recession.
In February 2007, 10 months before the recession began, the sector employed 232,000 workers; today it employs 222,000 workers on a seasonally adjusted basis.
However, wages in the sector have increased in real terms. The average hourly wage for financial workers in January 2007 was $36.45 compared to today’s average hourly wage of $42.55. The ascent in wages picked up slightly in July 2007 as jobs in the sector began to recover.
As defined by the BLS, the financial sector classification includes finance, insurance, real estate, rental and leasing subsectors.
Monday, September 24, 2018
Comments on the MA Employment Situation for August 2018: U-Rate: 3.6%; Jobs: +6,100 jobs; +68,100 YoY
OVERVIEW
- The state’s unemployment rate remained at 3.6 percent in August according to the federal Bureau of Labor Statistics.
- Over the last 12 months, Massachusetts added 68,100 jobs.
- The Labor Force Participation rate increased three-tenths of a percentage point to 67.6 percent.
- The state’s labor force population stands at 3.806 million. Since August 2017, the LFP rate is up 2.1 percentage points.
- The largest private sector job gains took place in the Education and Health Services (+2,500) the Leisure and Hospitality (+1,700), Professional, Scientific and Business Services (+1,500), Information (+900) and Construction (+500).
- Manufacturing and Trade, Transportation and Utilities each lost 600 jobs. Other Services lost 100 while Government added 100 jobs; over the past year this sector lost 500 jobs.
ANALYSIS
The August unemployment rate in Massachusetts again was three-tenths of a percentage point lower than the national rate of 3.9 percent.
"The August estimates indicate the Commonwealth’s labor force and employment are at their highest levels while our unemployment rate remains consistently low - all indicators of the continuing positive economic outlook for the Commonwealth of Massachusetts." Labor and Workforce Development Secretary Rosalin Acosta said last Friday.
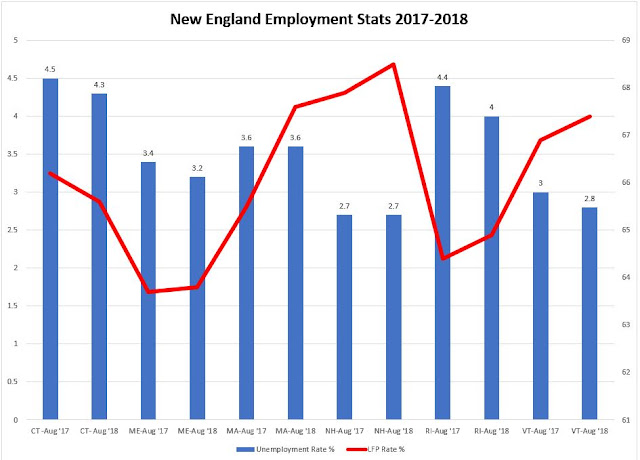
Massachusetts is the locomotive pulling New England states. New Hampshire was the only other New England with a statistically significant change from last August. Maine, along with New Hampshire and Vermont were the NE states with unemployment rates significantly different than the U.S. rate. Only one state, Connecticut saw a downturn in its LFP rate from 66.2 to 65.6 percent.
Year to date, all NE states are near the November 2017 estimates for 2018 by the New England Economic Partnership. (MA: 3.7; ME: 3.3; RI: 4.0; VT:3.0; NH 2.5 and CT: 48.)

Monday, July 2, 2018
Progressives Logroll Themselves Out of a Pro-Tax Constitutional Amendment … But For How Long? | NewBostonPost
My latest contribution to NewBostonPost.com: A look at last week's SJC ruling on the so-called "millionaire's tax." Link
Monday, November 20, 2017
A look at the MA jobs picture for October 2017

Source: Executive Office of Labor and Workforce Development, Author's calculations.
Wednesday, November 15, 2017

Tuesday, September 5, 2017
Which sectors provided the most job growth since January 2007: A 10-year look
 |
| Source: Bureau of Labor Statistics, CES Series |
Last Friday, the Bureau of Labor Statistics reported the U.S. economy created 156,000 jobs in August 2017, a number below economists' consensus estimates. The unemployment rate "was little unchanged" according to the BLS, but actually ticked upward to 4.4 percent. Major job gains emerged in manufacturing, construction, professional and technical services, health care and mining. How have these sectors fared since the peak before the Great Recession, which began in December 2007 and ended in June 2009? How does Friday's snapshot relate to longer term trends?
The decline in manufacturing jobs in the United States has trended downward over the decades. Few workers are producing more output. The interesting takeaway from this chart is the decline in construction jobs. Despite the uptick in the economy, construction jobs are down 800,000 since January 2007. The high-paying education and health services and professional the business services added more than two-thirds of the decade long gain to total non-farm employment. Less impressive is the gain in the generally lower paid professions of leisure and hospitality which added 2.6 million since January 2007.
Thursday, August 17, 2017
Today's Massachusetts jobs number: 4.3% U-rate; 200 jobs lost in July 2017
OVERVIEW
- The state’s total unemployment rate increased to 4.3 percent in July and lost 200 jobs according to the Executive Office of Labor and Workforce Development.
- Since last July the state’s economy has added 45,200 jobs while the state’s labor force participation rate has increased by 1.5 percent.
- The strongest job growth came in the Construction (+2,500), with Financial Activities and Education & Health Services each adding 1,300 jobs.
- Trade, Transportation & Utilities lost 1,400 jobs over the month while Leisure and Hospitality lost 900 jobs. Information lost 300 jobs; Professional, Scientific and Business Services lost 100.
- Government lost 1,700 jobs over the month and Other Services lost 1,400 jobs.
- The new jobs estimate for June was revised to 10,900 from the 10,000 jobs reported originally.
- Over the past year, the Health Care and Social Assistance subsector added 20,600 jobs, a sector whose year-over-year growth is nearly four times that of the growth of the Financial Activities sector.
- On average, Massachusetts employment grew by 3,767 jobs a month since last July.
- On average, the private sector generated 3,575 jobs monthly over the past 13 months.
ANALYSIS
The state’s unemployment rate, which inched up in July, has converged with the national rate at 4.3 percent.
According to the EOLWD, the last time the state and national rates matched was April 2008 when the rate was 5.0 percent. Over the year, the state’s seasonally adjusted unemployment rate increased seven-tenths of a percentage point from 3.6 percent in July 2016.
Meanwhile, the LFP rate increased by three-tenths of a point to 66.4 percent in July.
The labor force decreased by 11,300 from 3,708,800 in June, says EOLWD as 11,500 fewer residents were employed and 300 more residents were unemployed.
The unemployment rate remains at a stable low level but the state faces a skills gap. This may be reflected in the subpar growth of mid-tech jobs classified under Leisure and Hospitality and Other Services.
“Although the unemployment rate remains low, we continue to see persistent gaps between the skill sets of available workers and the qualifications needed for in-demand jobs,” Labor and Workforce Development Secretary Rosalin Acosta said.
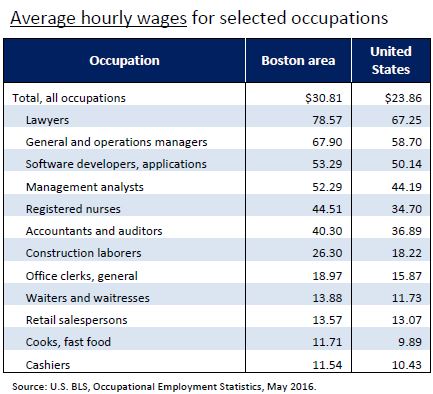
Job growth in Massachusetts continues to rely on the strength of the Education and Health Care and Professional Services super-sectors, which saw gains of 21,900 and 9,500 over the past year, respectively. In related news, the most recent Boston metropolitan survey released this week by the Bureau of Labor Statistics showed job growth over the past year across all sectors except for manufacturing.

Wednesday, July 12, 2017
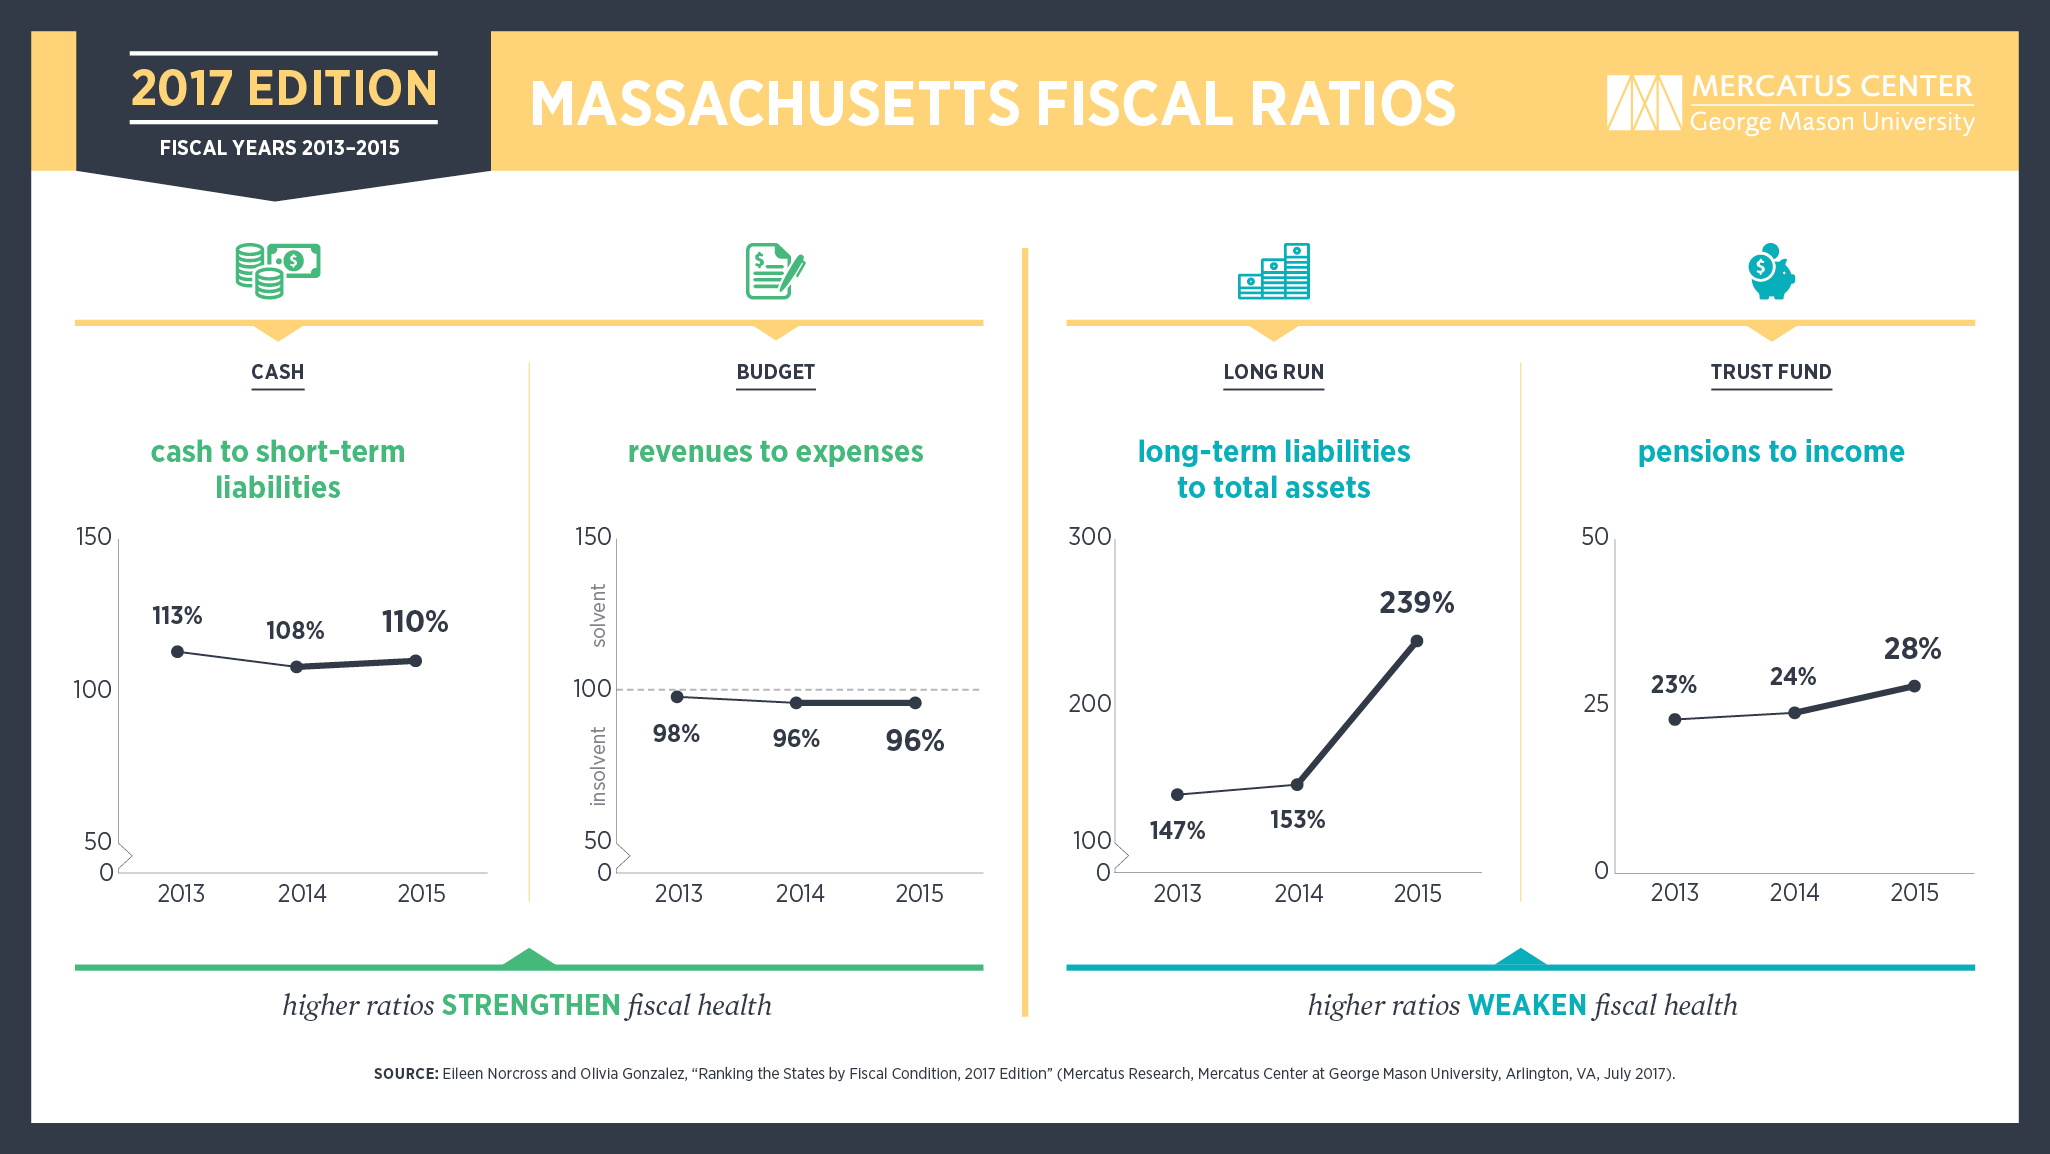
Mercatus Center: Massachusetts fiscal situation at risk
Massachusetts ranks 48th in fiscal health according to a new study from the Mercatus Center at George Mason University. Here's the summary:
Read the whole study. Here's a gated SHNS article on the study.
On the basis of its fiscal solvency in five separate categories, Massachusetts is ranked 48th among the US states for its fiscal health. On a short-run basis, Massachusetts holds between 45 percent and 111 percent of the cash needed to cover short-term obligations. Revenues cover 96 percent of expenses, and net position decreased by $319 per capita in FY 2015. On a long-run basis, a net asset ratio of −1.84 points to a heavy reliance on debt and large unfunded obligations. Long-term liabilities are 239 percent of total assets, for a per capita long-term liability of $9,919. Total primary government debt is $28.43 billion, or 6.9 percent of personal income, nearly twice the average in the states. The best score for Massachusetts was for trust fund solvency. On a guaranteed-to-be-paid basis, unfunded pension obligations are $115.75 billion, or 28 percent of state personal income. OPEB is 4 percent of state personal income.Here's an interesting chart:
Read the whole study. Here's a gated SHNS article on the study.
Subscribe to:
Posts (Atom)