"So, austerity is a second best policy, contingent on a particular kind of government failure. Alesina et al note that the effectiveness of austerity is controversial, with the discussion in the press “often taking a very ideological, harsh, and unproductive tone.” (page 3) The reasons given for why austerity should be selected by a government, or should be imposed as a condition of extension of loans by creditors, are obvious: (a) the ratio of debt to GDP has grown perilously large, raising questions about whether even the existing debt can be repaid, and (b) crises, fiscal needs arising from wars or major economic downturns in the business cycle or in currency exchange markets.
The critics claim that austerity is a moralistic, punitive policy designed to cause pain for excess deficits, one that fails even on its own logic because it actually pushes debt to GDP ratios higher rather than lower. The argument is that GDP shrinks sharply as government spending is cut, and even if debt falls, GDP falls by more which worsens the problem and causes an economic storm.
In a way, that’s the end of the story. Because Alesina, et al. are able to give a decisive resolution to the controversy: not all austerities are the same. In fact, there are two very different types: a focus on raising taxes, and a focus on cutting spending. When it comes to imposing an austerity of “sharply increased taxes” variety, the anti-austerity activists probably have the best of it. But when the austerity takes the form of large-scale cuts, not just in budgets but in entire programs, the larger weight of evidence by far falls on the “austerity works” side of the scale."
Read the whole review here.
A recent paper by Jan Ott from the journal Social Indicators Research.
Abstract:
The Heritage Foundation and the Fraser Institute measure economic freedom in nations using indices with ten and five indicators respectively. Eight of the Heritage indicators and four of the Fraser-indicators are about specific types of institutional quality, like rule of law, the protection of property, and the provision of sound money. More of these is considered to denote more economic freedom. Both indices also involve indicators of ‘big government’, or levels of government activities. More of that is seen to denote less economic freedom. Yet, levels of government spending, consumption, and transfers and subsidies appear to correlate positively with the other indicators related to institutional quality, while this correlation is close to zero for the level of taxation as a percentage of GDP. Using government spending, consumption transfers and subsidies as positive indicators is no alternative, because these levels stand for very different government activities, liberal or less liberal. This means that levels of government activities can better be left out as negative or positive indicators. Thus shortened variants of the indices create a better convergent validity in the measurement of economic freedom, and create higher correlations between economic freedom and alternative types of freedom, and between economic freedom and happiness. The higher correlations indicate a better predictive validity, since they are predictable in view of the findings of previous research and theoretical considerations about the relations between types of freedom and between freedom and happiness.
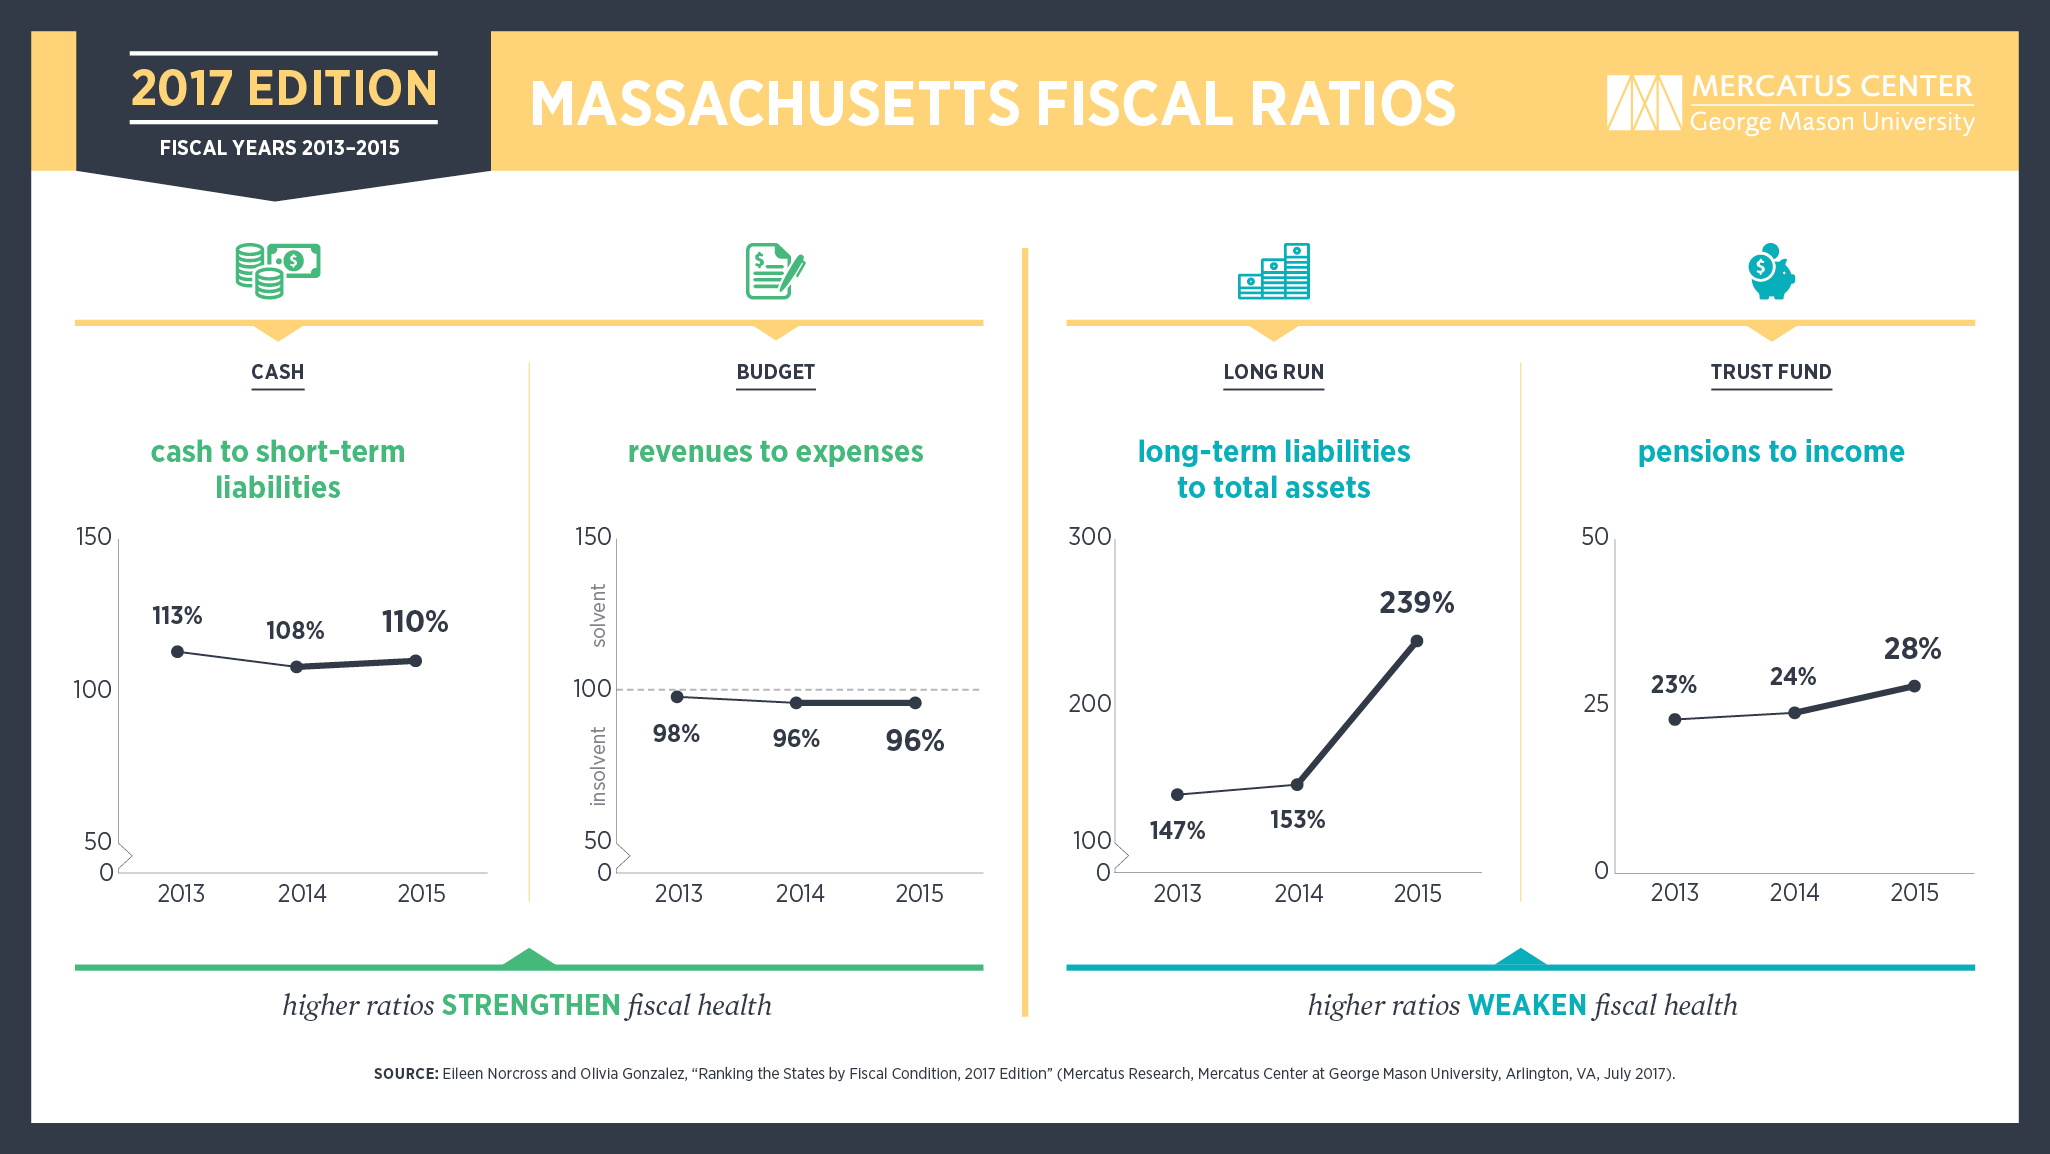
Massachusetts ranks 48th in fiscal health according to a new study from the Mercatus Center at George Mason University. Here's the summary:
On the basis of its fiscal solvency in five separate categories,
Massachusetts is ranked 48th among the US states for its fiscal health.
On a short-run basis, Massachusetts holds between 45 percent and 111
percent of the cash needed to cover short-term obligations. Revenues
cover 96 percent of expenses, and net position decreased by $319 per
capita in FY 2015. On a long-run basis, a net asset ratio of −1.84
points to a heavy reliance on debt and large unfunded obligations.
Long-term liabilities are 239 percent of total assets, for a per capita
long-term liability of $9,919. Total primary government debt is $28.43
billion, or 6.9 percent of personal income, nearly twice the average in
the states. The best score for Massachusetts was for trust fund
solvency. On a guaranteed-to-be-paid basis, unfunded pension obligations
are $115.75 billion, or 28 percent of state personal income. OPEB is 4
percent of state personal income.
Here's an interesting chart:
Read the whole study. Here's a gated SHNS article on the study.
A new paper from France:
This article addresses the issue of capital taxation relying on three levels of analysis. The first level deals with the multiple ways to tax capital (income or value, proportional or progressive taxation, and the temporality of the taxation) and presents some of France's particular features within a heterogeneous European context. The second area of investigation focuses on the main dynamic properties generated by capital taxation: the principle of equivalence with a tax on consumption; the issue of double taxation if it targets taxation of nominal income; neutrality of the uniform tax on the capital value; lastly, the risk of confiscatory taxation if there is a disjunction between taxation of the value and the income. The final level of analysis consists in assessing the debate on the optimal level of capital taxation drawing on the lessons in the literature. These discussions are organized into eight themes: (1) double taxation, (2) optimal growth, (3) property, (4) tax competition, (5) supervisory arguments, (6) measuring capital gains, (7) complexity and (8) fiscal stability.
The authors are Céline Antonin and Vincent Touzé.