
We try to explain why Italy's labor productivity stopped growing in the mid-1990s. We find no evidence that this slowdown is due to trade dynamics, Italy's inefficient governmental apparatus, or excessively protective labor regulations. By contrast, the data suggest that Italy's slowdown was more likely caused by the failure of its firms to take full advantage of the ICT revolution. While many institutional features can account for this failure, a prominent one is the lack of meritocracy in the selection and rewarding of managers. Familyism and cronyism are the ultimate causes of the Italian disease.Read more at NBER Working Papers.
Monday, October 30, 2017
New NBER Working Paper: Diagnosing the Italian Disease
A new working paper by Bruno Pellegrino and Luigi Zingales. From the abstract:

Friday, October 27, 2017
The Massachusetts economy is roaring

Massachusetts Benchmarks today reports:
Based on the latest available data, MassBenchmarks now estimates that the state economy grew at a 4.9 percent pace, versus 3.1 percent nationally during the second quarter of 2017. In the first quarter the BEA estimates that Massachusetts grew at a 1.1 percent rate as compared to 1.2 percent for the U.S.Read the entire report here.
Tuesday, October 24, 2017

Thursday, October 19, 2017
A one-year look at where the jobs are in Massachusetts
The state's total unemployment rate dropped to 3.9 percent in September from 4.2 percent according to the Executive Office of Labor and Workforce Development. From September 2016 to September 2017, BLS estimates Massachusetts has added 62,300 jobs.
Job growth was strong in the state's Health Care and Education and Professional Services supersectors. Specifically, the Health Care and Social Assistance subsector added 20,600 jobs since September 2016 with Professional, Scientific and Technical Services adding 8,500. Meanwhile, Construction added 6,200 jobs.

Job growth was strong in the state's Health Care and Education and Professional Services supersectors. Specifically, the Health Care and Social Assistance subsector added 20,600 jobs since September 2016 with Professional, Scientific and Technical Services adding 8,500. Meanwhile, Construction added 6,200 jobs.

Chart by East Boston Economics
Wednesday, October 4, 2017
Saturday, September 30, 2017
Wednesday, September 27, 2017
More money for Massachusetts transportation won't solve problems
The Massachusetts Taxpayers Foundation this week released a new report on the state's transportation system. Key take-away:
“What is clear is that the state lacks the requisite information to make profoundly difficult choices,” the report writes. “Questions such as which projects to fund and when, and how revenue sources should be allocated must be included as part of a long-term sustainable transportation finance plan to address our transportation needs. Unfortunately, the state has not yet adopted such a plan.”MassLive.com has a good summary of the report.
Boston Fed President Eric Rosengren: Trends point to higher inflation
From the Boston Fed:
Speaking in New York, Boston Fed President Eric Rosengren said that underlying trends suggest "an economy that risks pushing past what is sustainable, raising the probability of higher asset prices, or inflation well above the Federal Reserve's 2 percent target."
"Steps lowering the probability of such an outcome seem advisable – in other words, seem like insurance worth taking out at this time," he said. "As a result, it is my view that regular and gradual removal of monetary accommodation seems appropriate."
Noting that the weakness in inflation readings appears to be transitory, Rosengren said "the declines in the unemployment rate below the level most see as sustainable seem likely to be more long-lasting."
"Discerning the underlying trends in unemployment and inflation – looking through transitory effects – is likely to be quite difficult in coming months," Rosengren said, citing the impact of recent hurricanes on economic data.
In addition, Rosengren noted that the Federal Reserve's dual mandate indicators – employment and inflation – are sending somewhat conflicting signals of late: labor markets have continued to improve, yet inflation has slipped down a notch this year.
Asking how policymakers might resolve the conflicting signals when "the central bank's dual mandate is 'dueling,'" Rosengren explored the forecasts of both central bankers and private forecasters. Both suggest that by the end of next year, inflation is expected to be close to target, while the unemployment rate will continue to fall – and as a result, will move further below most estimates of a sustainable unemployment rate.
Read more: Trends and Transitory Shocks - Federal Reserve Bank of Boston
Speaking in New York, Boston Fed President Eric Rosengren said that underlying trends suggest "an economy that risks pushing past what is sustainable, raising the probability of higher asset prices, or inflation well above the Federal Reserve's 2 percent target."
"Steps lowering the probability of such an outcome seem advisable – in other words, seem like insurance worth taking out at this time," he said. "As a result, it is my view that regular and gradual removal of monetary accommodation seems appropriate."
Noting that the weakness in inflation readings appears to be transitory, Rosengren said "the declines in the unemployment rate below the level most see as sustainable seem likely to be more long-lasting."
"Discerning the underlying trends in unemployment and inflation – looking through transitory effects – is likely to be quite difficult in coming months," Rosengren said, citing the impact of recent hurricanes on economic data.
In addition, Rosengren noted that the Federal Reserve's dual mandate indicators – employment and inflation – are sending somewhat conflicting signals of late: labor markets have continued to improve, yet inflation has slipped down a notch this year.
Asking how policymakers might resolve the conflicting signals when "the central bank's dual mandate is 'dueling,'" Rosengren explored the forecasts of both central bankers and private forecasters. Both suggest that by the end of next year, inflation is expected to be close to target, while the unemployment rate will continue to fall – and as a result, will move further below most estimates of a sustainable unemployment rate.
Read more: Trends and Transitory Shocks - Federal Reserve Bank of Boston
Tuesday, September 12, 2017
35.  Tarnishing the Golden and Empire States: Land-Use Restrictions
and the U.S. Economic Slowdown
by Kyle F. Herkenhoff, Lee E. Ohanian, Edward C. Prescott  -  #23790 (EFG)

Abstract:

This paper studies the impact of state-level land-use restrictions on
U.S. economic activity, focusing on how these restrictions have
depressed macroeconomic activity since 2000.  We use a variety of
state-level data sources, together with a general equilibrium spatial
model of the United States to systematically construct a panel
dataset of state-level land-use restrictions between 1950 and 2014.
We show that these restrictions have generally tightened over time,
particularly in California and New York.  We use the model to analyze
how these restrictions affect economic activity and the allocation of
workers and capital across states.  Counterfactual experiments show
that deregulating existing urban land from 2014 regulation levels
back to 1980 levels would have increased US GDP and productivity
roughly to their current trend levels. California, New York, and the
Mid-Atlantic region expand the most in these counterfactuals, drawing
population out of the South and the Rustbelt.  General equilibrium
effects, particularly the reallocation of capital across states,
accounts for much of these gains.

http://papers.nber.org/papers/w23790?utm_campaign=ntw&utm_medium=email&utm_source=ntw
Structural Transformation, Deep Downturns, and Government Policy
Joseph E. Stiglitz
Most recessions are a result of some shock to the economic system,
typically amplified by financial accelerators, and leading to large
balance sheet effects of households and firms, which result in the
effects persisting. But, over time, the balance sheets get restored.
Even banks recover.
But
episodically, the “shock” is deeper. It is structural. Among advanced
countries, the movement from agricultural to manufacturing in the last
century, and the more recent movement from manufacturing to the service
sector reflect such a large economic transformation. The associated
downturns are longer lasting. The usual responses, in particular,
monetary policy, are only of limited efficacy. Policies have to be
designed to facilitate such transformations: markets on their own
typically do not do well.
This
paper explains why such transformations are associated with
persistently high unemployment, and describes the effects of particular
government policies. It looks at the lessons of the Great Depression
both for the advanced countries and the developing countries as they go
through their structural transformations.
You may purchase this paper on-line in .pdf format
from SSRN.com ($5) for electronic delivery.
Tuesday, September 5, 2017
Which sectors provided the most job growth since January 2007: A 10-year look
 |
| Source: Bureau of Labor Statistics, CES Series |
Last Friday, the Bureau of Labor Statistics reported the U.S. economy created 156,000 jobs in August 2017, a number below economists' consensus estimates. The unemployment rate "was little unchanged" according to the BLS, but actually ticked upward to 4.4 percent. Major job gains emerged in manufacturing, construction, professional and technical services, health care and mining. How have these sectors fared since the peak before the Great Recession, which began in December 2007 and ended in June 2009? How does Friday's snapshot relate to longer term trends?
The decline in manufacturing jobs in the United States has trended downward over the decades. Few workers are producing more output. The interesting takeaway from this chart is the decline in construction jobs. Despite the uptick in the economy, construction jobs are down 800,000 since January 2007. The high-paying education and health services and professional the business services added more than two-thirds of the decade long gain to total non-farm employment. Less impressive is the gain in the generally lower paid professions of leisure and hospitality which added 2.6 million since January 2007.
When pot laws are not the same across states, can we expect seepage?
In their new working paper, Benjamin Hansen, Keaton Miller, Caroline Weber ask "How Extensive is Inter-State Diversion of Recreational Marijuana?" Only a small amount they say.
Abstract:
Despite federal prohibition, recreational marijuana is available to 21% of the United States population. A chief concern among policy makers across multiple levels of government and political parties is inter-state diversion of marijuana from states with legal markets to others. We measure this diversion with a natural experiment. Oregon opened a recreational market on October 1, 2015, next to an existing market in Washington, which opened on July 8, 2014. Using comprehensive administrative data on the universe of Washington sales, we find Washington retailers along the Oregon border experienced a 41% decline in sales immediately following Oregon's market opening. Retailers along Washington's borders with Idaho and Canada experienced no such decline. The decline occurred equally across weekdays and weekends, and was largest among the largest transaction sizes, suggesting diversion, not drug tourism, was to blame. Our estimates suggest that 11.9% of the marijuana sold in Washington was diverted out of the state before Oregon legalized and
7.5% remains diverted today.
A gated copy of the research paper can be found here.
Abstract:
Despite federal prohibition, recreational marijuana is available to 21% of the United States population. A chief concern among policy makers across multiple levels of government and political parties is inter-state diversion of marijuana from states with legal markets to others. We measure this diversion with a natural experiment. Oregon opened a recreational market on October 1, 2015, next to an existing market in Washington, which opened on July 8, 2014. Using comprehensive administrative data on the universe of Washington sales, we find Washington retailers along the Oregon border experienced a 41% decline in sales immediately following Oregon's market opening. Retailers along Washington's borders with Idaho and Canada experienced no such decline. The decline occurred equally across weekdays and weekends, and was largest among the largest transaction sizes, suggesting diversion, not drug tourism, was to blame. Our estimates suggest that 11.9% of the marijuana sold in Washington was diverted out of the state before Oregon legalized and
7.5% remains diverted today.
A gated copy of the research paper can be found here.
Monday, August 21, 2017
Upon whom does an energy tax fall? Who bears the burden?
Who Bears the Economic Costs of Environmental Regulations? by Don Fullerton, Erich MuehleggerAbstract: Public economics has a well-developed literature on tax incidence - the ultimate burdens from tax policy. This literature is used here to describe not only the distributional effects of environmental taxes or subsidies but also the likely incidence of non-tax regulations, energy efficiency standards, or other environmental mandates. Recent papers find that mandates can be more regressive than carbon taxes. We also describe how the distributional effects of such policies can be altered by various market conditions such as limited factor mobility, trade exposure, evasion, corruption, or imperfect competition. Finally, we review data on carbon-intensity of production and exports around the world in order to describe implications for effects of possible carbon taxation on countries with different levels of income per capita.Complete working paper from the National Bureau of Economic Research.
Sunday, August 20, 2017
A new paper: Gender: An Historical Perspective
A new paper by Paola Giuliano
Social attitudes toward women vary significantly across societies. This
chapter reviews recent empirical research on various historical
determinants of contemporary differences in gender roles and gender gaps
across societies, and how these
differences are transmitted from parents to children and therefore
persist until today. We review work on the historical origin of
differences in female labor-force participation, fertility, education,
marriage arrangements, competitive attitudes, domestic
violence, and other forms of difference in gender norms. Most of the
research illustrates that differences in cultural norms regarding gender
roles emerge in response to specific historical situations, but tend to
persist even after the historical conditions
have changed. We also discuss the conditions under which gender norms
either tend to be stable or change more quickly.
|
|
Thursday, August 17, 2017
Today's Massachusetts jobs number: 4.3% U-rate; 200 jobs lost in July 2017
OVERVIEW
- The state’s total unemployment rate increased to 4.3 percent in July and lost 200 jobs according to the Executive Office of Labor and Workforce Development.
- Since last July the state’s economy has added 45,200 jobs while the state’s labor force participation rate has increased by 1.5 percent.
- The strongest job growth came in the Construction (+2,500), with Financial Activities and Education & Health Services each adding 1,300 jobs.
- Trade, Transportation & Utilities lost 1,400 jobs over the month while Leisure and Hospitality lost 900 jobs. Information lost 300 jobs; Professional, Scientific and Business Services lost 100.
- Government lost 1,700 jobs over the month and Other Services lost 1,400 jobs.
- The new jobs estimate for June was revised to 10,900 from the 10,000 jobs reported originally.
- Over the past year, the Health Care and Social Assistance subsector added 20,600 jobs, a sector whose year-over-year growth is nearly four times that of the growth of the Financial Activities sector.
- On average, Massachusetts employment grew by 3,767 jobs a month since last July.
- On average, the private sector generated 3,575 jobs monthly over the past 13 months.
ANALYSIS
The state’s unemployment rate, which inched up in July, has converged with the national rate at 4.3 percent.
According to the EOLWD, the last time the state and national rates matched was April 2008 when the rate was 5.0 percent. Over the year, the state’s seasonally adjusted unemployment rate increased seven-tenths of a percentage point from 3.6 percent in July 2016.
Meanwhile, the LFP rate increased by three-tenths of a point to 66.4 percent in July.
The labor force decreased by 11,300 from 3,708,800 in June, says EOLWD as 11,500 fewer residents were employed and 300 more residents were unemployed.
The unemployment rate remains at a stable low level but the state faces a skills gap. This may be reflected in the subpar growth of mid-tech jobs classified under Leisure and Hospitality and Other Services.
“Although the unemployment rate remains low, we continue to see persistent gaps between the skill sets of available workers and the qualifications needed for in-demand jobs,” Labor and Workforce Development Secretary Rosalin Acosta said.
Job growth in Massachusetts continues to rely on the strength of the Education and Health Care and Professional Services super-sectors, which saw gains of 21,900 and 9,500 over the past year, respectively. In related news, the most recent Boston metropolitan survey released this week by the Bureau of Labor Statistics showed job growth over the past year across all sectors except for manufacturing.

Monday, August 14, 2017
Is it worth it to compare state sales taxes when making a purchase?
A new National Bureau of Economic Research working paper from Scott R. Baker, Stephanie Johnson and Lorenz Kueng that might underscore the ongoing effects of interstate sales tax competition.
Abstract:
Using comprehensive high-frequency state and local sales tax data, we show that household spending responds strongly to changes in sales tax rates. Even though sales taxes are not observed in posted prices and have a wide range of rates and exemptions, households adjust in many dimensions, stocking up on storable goods before taxes rise and increasing online and cross-border shopping. Interestingly, households adjust spending similarly for both taxable and tax-exempt goods. We embed an inventory problem into a continuous-time consumption-savings model and demonstrate that this seemingly irrational behavior is optimal in the presence of shopping trip fixed costs. The model successfully matches estimated short-run and long-run tax elasticities with a reasonable implied reservation wage of $7-10. We provide additional empirical evidence in favor of this new shopping-complementarity mechanism. While our results reject non-salience of sales tax changes, on average, we also show that upcoming tax changes that are more salient prompt larger responses.
The paper, "Shopping for lower state sales tax rates," can be found here.
Abstract:
Using comprehensive high-frequency state and local sales tax data, we show that household spending responds strongly to changes in sales tax rates. Even though sales taxes are not observed in posted prices and have a wide range of rates and exemptions, households adjust in many dimensions, stocking up on storable goods before taxes rise and increasing online and cross-border shopping. Interestingly, households adjust spending similarly for both taxable and tax-exempt goods. We embed an inventory problem into a continuous-time consumption-savings model and demonstrate that this seemingly irrational behavior is optimal in the presence of shopping trip fixed costs. The model successfully matches estimated short-run and long-run tax elasticities with a reasonable implied reservation wage of $7-10. We provide additional empirical evidence in favor of this new shopping-complementarity mechanism. While our results reject non-salience of sales tax changes, on average, we also show that upcoming tax changes that are more salient prompt larger responses.
The paper, "Shopping for lower state sales tax rates," can be found here.
About those low wage jobs and robots: People versus machines: The Impact of minimum wages on at-risk jobs
A growing automated workforce of robots does not bode well for low-income workers, particularly older ones. Minimum wages don't help. Here's a new working paper by Grace Lordan, and David Neumark
Abstract:
We study the effect of minimum wage increases on employment in automatable jobs - jobs in which employers may find it easier to substitute machines for people - focusing on low-skilled workers from whom such substitution may be spurred by minimum wage increases. Based on CPS data from 1980-2015, we find that increasing the minimum wage decreases significantly the share of automatable employment held by low-skilled workers, and increases the likelihood that low-skilled workers in automatable jobs become unemployed. The average effects mask significant heterogeneity by industry and demographic group, including substantive adverse effects for older, low-skilled workers in manufacturing. The findings imply that groups often ignored in the minimum wage literature are in fact quite vulnerable to employment changes and job loss because of automation following a minimum wage increase.
More at NBER.
Abstract:
We study the effect of minimum wage increases on employment in automatable jobs - jobs in which employers may find it easier to substitute machines for people - focusing on low-skilled workers from whom such substitution may be spurred by minimum wage increases. Based on CPS data from 1980-2015, we find that increasing the minimum wage decreases significantly the share of automatable employment held by low-skilled workers, and increases the likelihood that low-skilled workers in automatable jobs become unemployed. The average effects mask significant heterogeneity by industry and demographic group, including substantive adverse effects for older, low-skilled workers in manufacturing. The findings imply that groups often ignored in the minimum wage literature are in fact quite vulnerable to employment changes and job loss because of automation following a minimum wage increase.
More at NBER.
Another study on health insurance for low-income adults based on the Massachusetts health care law
A new NBER Working Paper by Amy Finkelstein, Nathaniel Hendren, Mark Shepard

Abstract:

How much are low-income individuals willing to pay for health insurance, and what are the implications for insurance markets? Using administrative data from Massachusetts' subsidized insurance exchange, we exploit discontinuities in the subsidy schedule to estimate willingness to pay and costs of insurance among low-income adults.  As subsidies decline, insurance take-up falls rapidly, dropping about 25% for each $40 increase in monthly enrollee premiums.  Marginal enrollees tend to be lower-cost, consistent with adverse selection into insurance.  But across the entire distribution we can observe - approximately the bottom 70% of the willingness to pay distribution - enrollee willingness to pay is always less than half of own expected costs.  As a result, we estimate that take-up will be highly incomplete even with generous subsidies:  if enrollee premiums were 25% of insurers' average costs, at most half of potential enrollees would buy insurance; even premiums subsidized to 10% of average costs would still leave at least 20% uninsured. We suggest an important role for uncompensated care for the uninsured in explaining these findings and explore normative implications.

More here.
Saturday, July 29, 2017
Comment on the BEA report on Massachusetts GDP state
OVERVIEW
- Real gross domestic product (GDP) state increased in 43 states and the District of Columbia where real gross domestic product (GDP) increased in the first quarter of 2017, according to statistics on the geographic breakout of GDP released by the U.S. Bureau of Economic Analysis.
- The Massachusetts economy grew by 1.1 percent in the first quarter of 2017. This was slightly below the 1.2 national average.
- The growth rate was slower than the annual rate for 2016 which posted at 2.0 percent but was an improvement over the first quarter of 2016 which contracted by 2.0.
- Real GDP by state growth in the first quarter ranged from 3.9 percent in Texas to -4.0 percent in Nebraska. See Chart 1 from the BEA.
- As a region, the six states of New England only grew by 0.9 percent. The Southwest — Texas, New Mexico, Arizona and Oklahoma — grew the largest for Qtr1-2017 at 3.3 percent nearly three times the adjusted-for-state comparison U.S. rate of 1.2 percent.
- The current dollar size of the Massachusetts GDP by State is $519.9 billion.

ANALYSIS
GDP-State is the market value of goods and services produced by labor and property (or capital) in a state. The sum of GDP for all states released this week (1.2 percent for Qtr1-2017) differs from the national GDP number (1.2 percent)* since outputs like military and overseas activity can’t be attributed to any one state. The Massachusetts economy comprises 2.7 percent of the total U.S. economy according to the BEA update. New England, as a region comprises one of the smallest at 5.4 percent outpacing the Rocky Mountain states which accounts for 3.4 of the national total.
Real Estate and Rental and Leasing, Mining and Durable Goods Manufacturing were the leading contributors nationally. In Massachusetts, the leading contributions to the percent change were: Real Estate and Rental and Leasing, Construction, Health Care and Social assistance, Durable-goods Manufacturing, Wholesale Trade, Nondurable-goods Manufacturing, and Administrative and Waste Management Services. (See Table 1 p. 2.)
Massachusetts ranked 25th in growth during the first quarter. How did Massachusetts rank in this latest BEA report compared with its high-technology competitors? The state of Washington grew by 2.7 percent, Virginia by 2.0 percent while the Utah economy grew by 1.9 percent. Meanwhile, California slowed to 0.1 percent, Colorado by 0.4 percent; North Carolina grew by 0.7 percent as Minnesota contracted by 0.3 percent.
*Revised figure from 7/28 GDP press release; The originally reported figure was 1.4 percent.

Wednesday, July 26, 2017
Monday, July 24, 2017
The value of the mortgage interest deduction is overstated
A study that should have implications for tax reform. An optimal tax system collects revenue from the broadest base. Economists have long believed that the homeowner mortgage deduction misallocates capital to the housing sector. This new study, "Do People Respond to the Mortage Interest Deduction?: Quasi-Experimental Evidence from Denmark," from Jonathan Gruber, Amalie Jensen and Henrik Kleven finds that prospective homeowners are not swayed by the tax incentive.
Using linked housing and tax records from Denmark combined with a major reform of the mortgage interest deduction in the late 1980s, we carry out the first comprehensive long-term study of how tax subsidies affect housing decisions. The reform introduced a large and sharp reduction in the mortgage deduction for top-rate taxpayers, while reducing it much less or not at all for lower-rate taxpayers. We present three main findings. First, the mortgage deduction has a precisely estimated zero effect on homeownership. This holds even in the very long run. Second, the mortgage deduction has a sizeable impact on housing demand at the intensive margin, inducing homeowners to buy larger and more expensive houses. Third, the largest effect of the mortgage deduction is on household financial decisions, inducing them to increase indebtedness. These findings suggest that the mortgage interest deduction distorts the behavior of homeowners at the intensive margin, but is ineffective at promoting homeownership at the extensive margin and any externalities that may be associated with it.The paper is available at the National Bureau of Economic Research.
Friday, July 21, 2017
MA Employment Situation: Urate: 4.3 percent -- 10,000 jobs added in June
OVERVIEW
ANALYSIS
"During the first six months of 2017, Massachusetts has experienced the largest increase in the labor force on record, and the 66.7 labor force participation rate is now 3.9 points higher than the U.S. rate. These marked labor force gains should help ease labor market pressures and are signs of a growing economy in the Commonwealth," Labor and Workforce Development Secretary Rosalin Acosta said upon yesterday’s release.
The increase in the unemployment rate is due to the fact more workers are rejoining the labor force. The LWD office says that 121,400 workers re-entered the market from June 2016. Only construction and professional services lost jobs over the month. But all other sectors posted strong growth with education and health services leading the way.
Government continues to grow employment rising by 1.2 percent over the past year.
The growth in Massachusetts jobs should ensure that state income tax revenues grow, thus alleviating some of the sales tax revenue drift.
The often-neglected “Other Services” category continues to move with Professional, Scientific and Business Services as a percentage of total nonfarm employment, roughly 4 percent and 15 percent respectively.
- The state’s total unemployment rate increased to 4.3 percent in June from the May rate of 4.2 percent according to the Executive Office of Labor and Workforce Development.
- Preliminary estimates suggest that Massachusetts added 10,000 jobs in June. Since last June the economy has added 65,900 jobs.
- The labor force participation rate (LFP) remained at 66.7 percent over the month; however, this represents a 1.8 percent increase from June 2016.
- Education and Health Services added 6,700 jobs over the month. Over the year, Education and Health Services gained 28,200 jobs.
- Information added 200 jobs over the month; over the year, this sector gained 1,300 jobs.
- Federal, state and local government combined gained 400 jobs (5,500 over the past 12 months).
- Professional, Scientific, Business Service subsector lost 2,200 jobs bringing year over year to 13,900.
- Construction lost 2,800 jobs in June but since last year the sector has added 1,800 jobs.
- In June, the manufacturing sector gained 500 jobs but posted a 12-month loss of 1,400 jobs.
- The May estimate was revised with a gain of 2,000 jobs as opposed to the 2,900 originally reported.
ANALYSIS
"During the first six months of 2017, Massachusetts has experienced the largest increase in the labor force on record, and the 66.7 labor force participation rate is now 3.9 points higher than the U.S. rate. These marked labor force gains should help ease labor market pressures and are signs of a growing economy in the Commonwealth," Labor and Workforce Development Secretary Rosalin Acosta said upon yesterday’s release.
The increase in the unemployment rate is due to the fact more workers are rejoining the labor force. The LWD office says that 121,400 workers re-entered the market from June 2016. Only construction and professional services lost jobs over the month. But all other sectors posted strong growth with education and health services leading the way.
Government continues to grow employment rising by 1.2 percent over the past year.
The growth in Massachusetts jobs should ensure that state income tax revenues grow, thus alleviating some of the sales tax revenue drift.
The often-neglected “Other Services” category continues to move with Professional, Scientific and Business Services as a percentage of total nonfarm employment, roughly 4 percent and 15 percent respectively.
Both are strongly correlated. The Bureau of Labor Statistics defines “Other Services” as those jobs (except for Public Administration) that provide services such as machine repair, administering religious services, grantmaking, personal and pet care services as well as other establishments. Sector growth since the last recession has been mostly flat at 0.22 percent since 2007.

Thursday, July 20, 2017
Currently reading: Dani Rodrik's ECONOMICS RULES: THE RIGHTS AND WRONGS OF THE DISMAL SCIENCE

Thus far a wonderful explanation on economic models. Can't wait to finish it.
Monday, July 17, 2017
Retail urgent care: It helps
A new working paper from Diane Alexander, Janet Currie, Molly Schnell examines a much-needed innovation in health care deliveries:Retail clinics are an innovation that has the potential to improve competition in health care markets. We use the universe of emergency room (ER) visits in New Jersey from 2006-2014 to examine the impact of retail clinics on ER usage. We find significant effects of retail clinics on ER visits for both minor and preventable conditions; Residents residing close to an open clinic are 4.1-12.3 percent less likely to use an ER for these conditions. Our estimates suggest annual cost savings from reduced ER usage of over $70 million if retail clinics were made readily available across New Jersey.A few years ago, Boston Mayor Menino prevented the opening of such "minute clinics" at CVS stores primarily to protect Boston Medical Center and community health centers. There's a public choice lesson to be learned.
New Working Paper: The Employment Effects of Minimum Wages: Some Questions We Need to Answer
Here's a new paper from labor economist David Neumark:
The literature on the employment effects of minimum wages is about a century old, and includes hundreds of studies. Yet the debate among researchers about the employment effects of minimum wages remains intense and unsettled. This essay discussed the key questions that have arisen in the past research that, if we can answer them, may prove most useful in making sense of the conflicting evidence. I also focus on additional questions we should consider to better inform the policy debate, in particular in the context of the very high minimum wages coming on line in the United States, about which past research is quite uninformative.Certain to add to the debate on how we think about minimum wages in the U.S.
Wednesday, July 12, 2017
Mercatus Center: Massachusetts fiscal situation at risk
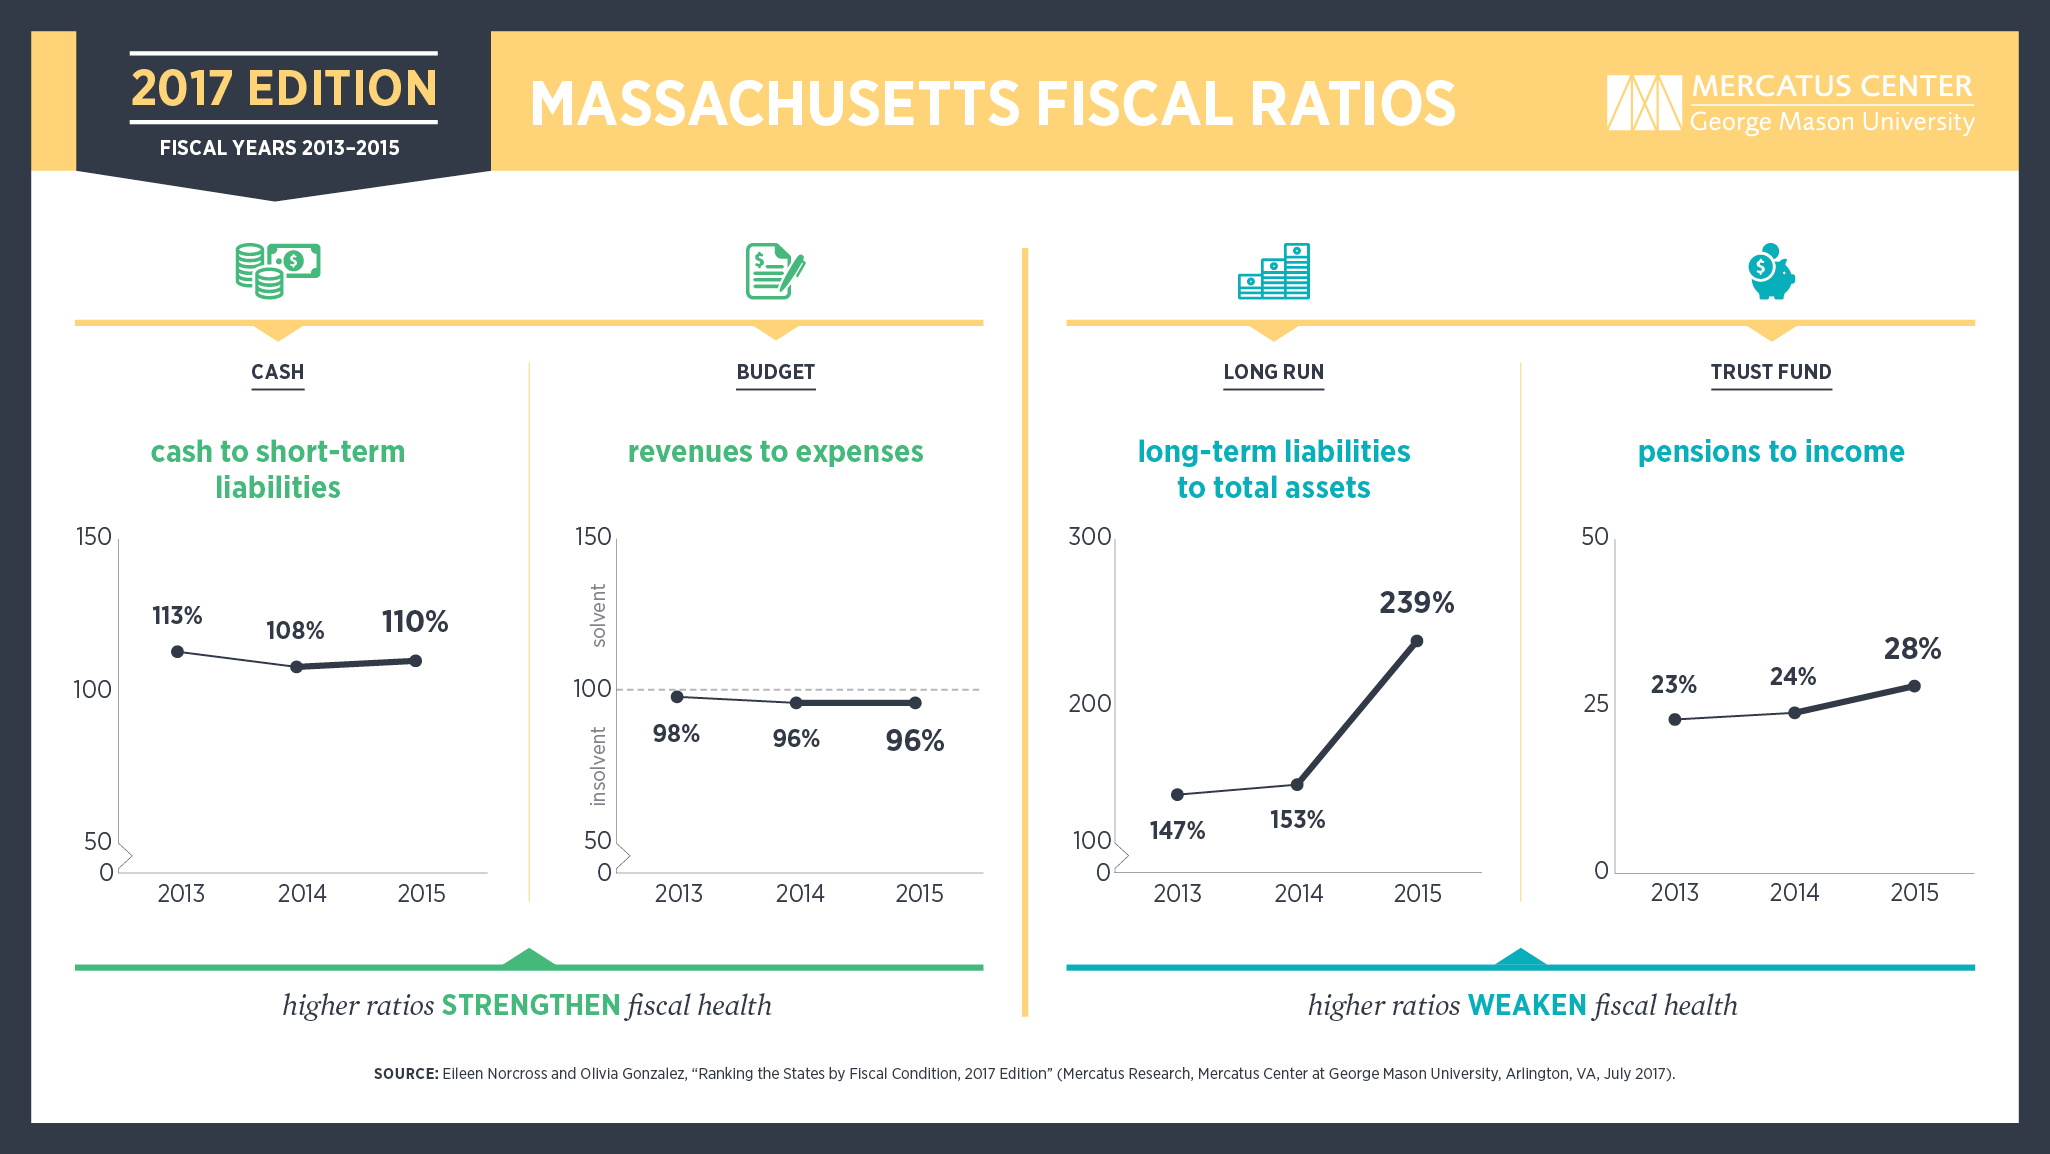
Massachusetts ranks 48th in fiscal health according to a new study from the Mercatus Center at George Mason University. Here's the summary:
Read the whole study. Here's a gated SHNS article on the study.
On the basis of its fiscal solvency in five separate categories, Massachusetts is ranked 48th among the US states for its fiscal health. On a short-run basis, Massachusetts holds between 45 percent and 111 percent of the cash needed to cover short-term obligations. Revenues cover 96 percent of expenses, and net position decreased by $319 per capita in FY 2015. On a long-run basis, a net asset ratio of −1.84 points to a heavy reliance on debt and large unfunded obligations. Long-term liabilities are 239 percent of total assets, for a per capita long-term liability of $9,919. Total primary government debt is $28.43 billion, or 6.9 percent of personal income, nearly twice the average in the states. The best score for Massachusetts was for trust fund solvency. On a guaranteed-to-be-paid basis, unfunded pension obligations are $115.75 billion, or 28 percent of state personal income. OPEB is 4 percent of state personal income.Here's an interesting chart:
Read the whole study. Here's a gated SHNS article on the study.
Monday, July 10, 2017
Economist Dani Rodrik: Populism should not be a surprise
The new Dani Rodrik paper: Populism and the Economics of Globalization
Populism may seem like it has come out of nowhere, but it has been on the rise for a while. I argue that economic history and economic theory both provide ample grounds for anticipating that advanced stages of economic globalization would produce a political backlash. While the backlash may have been predictable, the specific form it took was less so. I distinguish between left-wing and right-wing variants of populism, which differ with respect to the societal cleavages that populist politicians highlight. The first has been predominant in Latin America, and the second in Europe. I argue that these different reactions are related to the relative salience of different types of globalization shocks.
Subscribe to:
Posts (Atom)