A new NBER working paper, "Overcoming Wealth Inequality by Capital Taxes that Finance Public Investment," by Linus Mattauch, David Klenert, Joseph E. Stiglitz, and Ottmar Edenhofer
Abstract:
Wealth inequality is rising in rich countries. Capital taxation used simply to finance redistribution may not be able to counteract this trend, but can increased public investment financed by higher capital taxes? We examine how such a policy affects the distribution of wealth in a setting with distinct wealth groups: dynastic savers and life-cycle savers. Our main finding is that public investment financed through capital taxes always decreases wealth inequality when the elasticity of substitution between capital and labor is moderately high. Indeed, for all elasticities of substitution greater than a threshold value, at high enough capital tax rates, dynastic savers disappear in the long run. Below these rates, both types of households co-exist in equilibrium with life-cycle savers
gaining from the higher capital tax rates. These results are robust with respect to the different roles of public investment in production. We calibrate our model to OECD economies and find the threshold elasticity to be 0.82.
More here.
Monday, October 8, 2018
Notable read: James Dorn on Leland B. Yeager
From the just-released Fall 2018 issue of Cato Journal: James Dorn memorializes Leland Yeager, a member of the Virginia School of Political Economy.
Abstract:
In this memorial essay, I wish to paint a picture of Leland as a “market grandmaster,” in the sense of his keen understanding of markets and prices along with the role of money in facilitating exchange, and the importance of property rights in shaping incentives and behavior. Along with James Buchanan, Gordon Tullock, Ronald Coase, G. Warren Nutter, Roland McKean, and others, he was an important member of the Virginia School of Political Economy.
Friday, October 5, 2018
U.S. Employment Situation: 3.7% unemployment rate with 134,000 new payrolls
OVERVIEW
ANALYSIS
Total nonfarm payroll employment rose by 134,000 in September well below the 12-month average of 201,000. Wall Street expected a payroll increase by 185,000 jobs. The BLS reported 121,000 new private sector jobs were created compared with the ADP payrolls report released earlier this week of 230,000 private payrolls.
While jobs created were below expectations, the BLS revised numbers for July (from 147,000 to 165,000) and August from 201,000 to 270.000). After revisions, the BLS found the three-month average for new jobs arrived at 190,000 per month. Manufacturing continues to improve. Over the past year the sector has added 278,000 jobs — four-fifths of that growth taking place in the high-wage durable goods sector.
That could continue to improve as the nation’s manufacturing system continues to express optimism despite a worker shortage. According to the National Association of Manufacturers, “Nearly 93 percent of manufacturers are projecting further expansion for their businesses, and positive sentiment among smaller companies is up to 91.3 percent.”
In one of the only downsides of today’s report, Hurricane Florence may have caused some weakness in the Leisure and hospitality sector (-17,000).
Hispanic unemployment is at an all-time low.
Unemployment drifted downward for all groups by educational attainment (See chart below). "The labor market is in excellent shape heading into the end of 2018, perhaps the best it has been in 50 years," Gus Faucher, chief economist at PNC told CNBC. "Job growth was a bit softer in September, but some of that was from Hurricane Florence, and it should bounce back through the rest of 2018 and into 2019."
- The unemployment rate dropped to 3.7 percent in September with payrolls expanding by 134,000 jobs, according to the Bureau of Labor Statistics. The unemployment rate is the lowest since 1969.
- The Labor Force Participation (LFP) remained at 62.7 percent. The Employment-population ratio finished for the month at 60.4 percent, little changed. The number of unemployed for the month was 6.0 million, declining by 270,000.
- The economy added 137,000 jobs in September. Job gains took place in Professional and business services (+54,000), Health care (+26,000) and the Transportation and warehousing sector (+24,000).
- In addition, Construction added 23,000 jobs while Manufacturing added 18,000 jobs.
- According to the BLS, the following sectors saw little or no change in employment: Wholesale trade, Retail trade, Information, Financial activities and Government.
- Over the year, average hourly earnings have increased by 73 cents or 2.8 percent. In September the average hourly private nonfarm wage rang in at $27.24, an increase of eight cents. The average workweek for all employees was unchanged at 34.5 hours.
- Despite Hurricane Florence, the BLS said its surveys were within normal ranges. Major analysts appeared to agree.
- The number of persons employed part-time for economic reasons increased by 263,000 to 4.6 million. The number of long-term unemployed was little changed at 1.4 million. This group represents 22.9 of all unemployed persons.
ANALYSIS
Total nonfarm payroll employment rose by 134,000 in September well below the 12-month average of 201,000. Wall Street expected a payroll increase by 185,000 jobs. The BLS reported 121,000 new private sector jobs were created compared with the ADP payrolls report released earlier this week of 230,000 private payrolls.
While jobs created were below expectations, the BLS revised numbers for July (from 147,000 to 165,000) and August from 201,000 to 270.000). After revisions, the BLS found the three-month average for new jobs arrived at 190,000 per month. Manufacturing continues to improve. Over the past year the sector has added 278,000 jobs — four-fifths of that growth taking place in the high-wage durable goods sector.
That could continue to improve as the nation’s manufacturing system continues to express optimism despite a worker shortage. According to the National Association of Manufacturers, “Nearly 93 percent of manufacturers are projecting further expansion for their businesses, and positive sentiment among smaller companies is up to 91.3 percent.”
In one of the only downsides of today’s report, Hurricane Florence may have caused some weakness in the Leisure and hospitality sector (-17,000).
Hispanic unemployment is at an all-time low.
Unemployment drifted downward for all groups by educational attainment (See chart below). "The labor market is in excellent shape heading into the end of 2018, perhaps the best it has been in 50 years," Gus Faucher, chief economist at PNC told CNBC. "Job growth was a bit softer in September, but some of that was from Hurricane Florence, and it should bounce back through the rest of 2018 and into 2019."
 |
| Chart by East Boston Economics - BLS,Table A4 - Educational Attainment |
Wednesday, October 3, 2018

Tuesday, October 2, 2018
New article from Econ Journal Watch: And the IMF Said, Let There Be Data, and There Was Data: Private Capital Stocks in the Eastern Bloc
From two graduates of the Suffolk University PhD program in Economics I had the pleasure of knowing and working with over the years. Here's Ryan Murphy and Colin O'Reilly's new paper.
And the IMF Said, Let There Be Data, and There Was Data: Private Capital Stocks in the Eastern Bloc
Abstract
The International Monetary Fund has recently published a dataset on public and private capital stocks for 170 countries from 1960–2015 using the perpetual inventory methodology. Following a reckless assumption, opaquely imposed, the dataset likely overstates levels of private investment as a percentage of total investment in former Eastern bloc countries, and thereby likely overstates their private capital stocks. This comment explores the nature and implications of the assumption, and suggests that, in light of the problem, the scope of the IMF project be significantly diminished to address the issue.
Read more here (PDF).
Hat tip to MarginalRevolution.com.
Tuesday, September 25, 2018
The relationship between venture capital and growth
 |
| https://commons.wikimedia.org/wiki/File:Investing_money.jpg |
From "Financing Ventures," a new paper by Jeremy Greenwood, Juan Sanchez and Pengfei Han
Abstract:
The relationship between venture capital and growth is examined using an endogenous growth model incorporating dynamic contracts between entrepreneurs and venture capitalists. At each stage of fi nancing, venture capitalists evaluate the viability of startups. If viable, VCs provide funding for the next stage. The success of a project depends on the amount of funding. The model is confronted with stylized facts about venture capital; viz., statistics by funding round concerning the success rate, failure rate, investment rate, equity shares, and the value of an IPO. Raising capital gains taxation reduces growth and welfare.
The paper is available here.

Monday, September 24, 2018
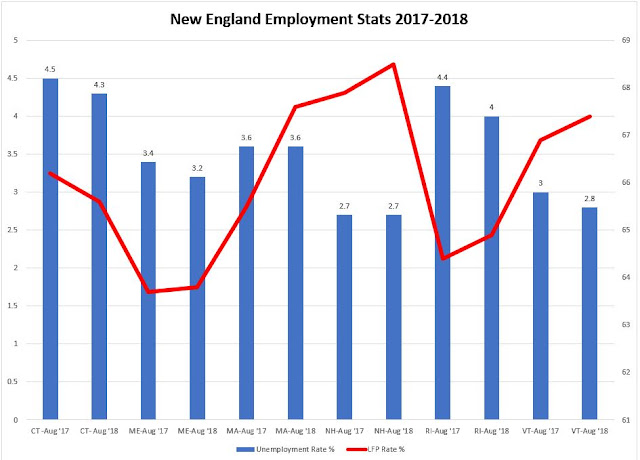
Comments on the MA Employment Situation for August 2018: U-Rate: 3.6%; Jobs: +6,100 jobs; +68,100 YoY
OVERVIEW
- The state’s unemployment rate remained at 3.6 percent in August according to the federal Bureau of Labor Statistics.
- Over the last 12 months, Massachusetts added 68,100 jobs.
- The Labor Force Participation rate increased three-tenths of a percentage point to 67.6 percent.
- The state’s labor force population stands at 3.806 million. Since August 2017, the LFP rate is up 2.1 percentage points.
- The largest private sector job gains took place in the Education and Health Services (+2,500) the Leisure and Hospitality (+1,700), Professional, Scientific and Business Services (+1,500), Information (+900) and Construction (+500).
- Manufacturing and Trade, Transportation and Utilities each lost 600 jobs. Other Services lost 100 while Government added 100 jobs; over the past year this sector lost 500 jobs.
ANALYSIS
The August unemployment rate in Massachusetts again was three-tenths of a percentage point lower than the national rate of 3.9 percent.
"The August estimates indicate the Commonwealth’s labor force and employment are at their highest levels while our unemployment rate remains consistently low - all indicators of the continuing positive economic outlook for the Commonwealth of Massachusetts." Labor and Workforce Development Secretary Rosalin Acosta said last Friday.
Massachusetts is the locomotive pulling New England states. New Hampshire was the only other New England with a statistically significant change from last August. Maine, along with New Hampshire and Vermont were the NE states with unemployment rates significantly different than the U.S. rate. Only one state, Connecticut saw a downturn in its LFP rate from 66.2 to 65.6 percent.
Year to date, all NE states are near the November 2017 estimates for 2018 by the New England Economic Partnership. (MA: 3.7; ME: 3.3; RI: 4.0; VT:3.0; NH 2.5 and CT: 48.)

Monday, September 17, 2018

Friday, September 7, 2018
U.S. Employment Situation August 2018: U-Rate: 3.9%; Jobs: +201,000
OVERVIEW
Job growth continued into August with 201,000 payroll jobs added. The consensus estimate centered around 191,000, according to CNBC.
Employment growth in August fell in line with the average monthly growth of 196,000 for the past 12 months.
The BLS reported that 204,000 private sector jobs were created during the month. Earlier in the week, ADP reported an increase of 163,000 nonfarm private sector jobs for August. Hindsight took some —but not much— enthusiasm out of previous two monthly payrolls reports. The BLS revised the payroll number for June 2018 to 208,000 from 248,000 and did the same for July 2018 — revising that month’s number to 147,000 from the 157,000 previously reported.
Examining five years of August data, economists expect the month’s numbers to be revised upward. The new numbers show the three-month average showed up at the rate of 185,000 jobs. The number of long-term unemployed (for more than 27 weeks or more) was little changed in August although over the past year the number had declined by 403,000. This group accounted for 21.5 percent of U.S. unemployment.
The energy sector, after a near two-year slump, generated 104,000 jobs “almost entirely in support activity for mining.”
Manufacturing is at a sweet spot, while employment changed little in this sector, employment was up by 254,000 with more than three fourths coming the durable goods segment.
The latest jobs and wages reports provide little ammunition for doves at the Federal Reserve Bank. There are no reasons to keep interest rates low. The Fed wanted to see growth in wages before hiking and its clear wages are moving in the right direction.
The economy is at a peak. Business confidence is up and supported by consumer optimism. “Today’s strong economy is finally translating into wage gains for more workers,” Andrew Chamberlain, chief economist of the labor-market research firm Glassdoor told MarketWatch.

- The unemployment rate remained 3.9 percent in August with payrolls expanding by 201,000 jobs, according to the Bureau of Labor Statistics.
- The Labor Force Participation (LFP) declined to 62.7 percent. The Employment-population ratio also declined in August by 0.2 to 60.3 percent. The number of unemployed for the month was 6.2 million, little changed from July.
- Among the major groups, the unemployment rate for adult men was 3.5 and 3.6 percent, respectively. Among minority groups, unemployment was 6.3 percent (Blacks), 3.0 percent (Asians) and 4.7 percent (Hispanics).
- In August, employment grew in the Wholesale trade, Health care, Professional services, Transportation and warehousing, and Mining.
- Professional and business services added 53,000 jobs.
- Wholesale trade added 22,000 jobs while Health care added 33,000. Wholesale trade benefited from the growth in durable good wholesale subsector while health care benefited from gains in the ambulatory and hospital subsectors.
- Manufacturing changed little in August.
- Month over month, employment in the other major sectors—Retail trade, Financial activities, Leisure and hospitality—changed little.
- Over the year, average hourly earnings have increased by 77 cents or 2.9 percent. In August the average hourly private nonfarm wage rang in at $27.16.
- The average workweek for all employees was unchanged at 34.5 hours.
- The number of persons employed part-time for economic reasons changed little over the month but was down by 830,000 over the year.
Job growth continued into August with 201,000 payroll jobs added. The consensus estimate centered around 191,000, according to CNBC.
Employment growth in August fell in line with the average monthly growth of 196,000 for the past 12 months.
The BLS reported that 204,000 private sector jobs were created during the month. Earlier in the week, ADP reported an increase of 163,000 nonfarm private sector jobs for August. Hindsight took some —but not much— enthusiasm out of previous two monthly payrolls reports. The BLS revised the payroll number for June 2018 to 208,000 from 248,000 and did the same for July 2018 — revising that month’s number to 147,000 from the 157,000 previously reported.
Examining five years of August data, economists expect the month’s numbers to be revised upward. The new numbers show the three-month average showed up at the rate of 185,000 jobs. The number of long-term unemployed (for more than 27 weeks or more) was little changed in August although over the past year the number had declined by 403,000. This group accounted for 21.5 percent of U.S. unemployment.
The energy sector, after a near two-year slump, generated 104,000 jobs “almost entirely in support activity for mining.”
Manufacturing is at a sweet spot, while employment changed little in this sector, employment was up by 254,000 with more than three fourths coming the durable goods segment.
The latest jobs and wages reports provide little ammunition for doves at the Federal Reserve Bank. There are no reasons to keep interest rates low. The Fed wanted to see growth in wages before hiking and its clear wages are moving in the right direction.
The economy is at a peak. Business confidence is up and supported by consumer optimism. “Today’s strong economy is finally translating into wage gains for more workers,” Andrew Chamberlain, chief economist of the labor-market research firm Glassdoor told MarketWatch.

Tuesday, September 4, 2018
Sunday, September 2, 2018
Saturday, September 1, 2018
Sunday, August 19, 2018
Friday, August 17, 2018
Wednesday, August 15, 2018
The latest productivity stats from the BLS
U.S. worker productivity accelerated this spring at the best pace in more than three years https://t.co/oqXRWTNKJK pic.twitter.com/cl4NS1f96Q— Real Time Economics (@WSJecon) August 15, 2018
Tuesday, August 7, 2018
America's Trade Deficit Is Still Growing and That's Just Fine!
"A country is far more likely to run a trade deficit when its economy is booming and personal consumption is high," writes Daniel Drezner, a professor of international politics at Tufts University, in The Washington Post. "If Trump really wanted to shrink the trade deficit, he would push to revoke his own tax bill. But he really does not want to do this."
From Reason.com: America's Trade Deficit Is Still Growing -- And that's just fine

From Reason.com: America's Trade Deficit Is Still Growing -- And that's just fine
Monday, August 6, 2018

Robert Gordon revisits the Phillips Curve
"Friedman and Phelps on the Phillips Curve Viewed from a Half Century's Perspective" a new NBER working paper by Robert J. Gordon.
Abstract:
In the late 1960s the stable negatively sloped Phillips Curve (PC) was overturned by the Friedman-Phelps natural rate model. Their PC was vertical in the long run at the natural unemployment rate, and their short-run curve shifted up whenever unemployment was pushed below the natural rate.
This paper criticizes the underlying assumption of the Friedman-Phelps approach that the labor market continuously clears and that changes in unemployment down or up occur only in response to "fooling" of workers, firms, or both. A preferable and resolutely Keynesian approach explains quantity rationing by inertia in price and wage setting. The positive correlation of inflation and unemployment in the 1970s and again in the 1990s is explained by joining the negatively sloped Phillips Curve with a positively sloped dynamic demand curve. For any given growth of nominal GDP, higher inflation caused by adverse supply shocks implies slower real GDP growth and higher unemployment.
This "triangle" model based on inflation inertia, demand, and supply worked well to explain why inflation and unemployment were both positively and negatively correlated between the 1960s and 1990s, but in the past decade the slope of the short-run Phillips Curve has flattened as inflation exhibited a muted response to high unemployment in 2009-13 and low unemployment in 2016-2018.
It remains to be seen whether a continuation of low unemployment will cause a
modest and fixed extra amount of inflation, thus reviving the stable Phillips curve of the early 1960s, or whether inflation will continuously accelerate as Friedman and Phelps would have predicted.
Gated version available here.
Saturday, August 4, 2018
Note on the U.S. Employment Situation: July 2018 - 3.9% U-Rate; +157,000 jobs
OVERVIEW

ANALYSIS
The U.S. economy added 157,000 jobs failing to meet the consensus figure of 190,000. However, the report looks even better when considering the moving three-month average of 224,000. That’s because figures for the previous two-months were revised upward (+244,000 to +268,000 for May and +213,000 to +248,000 for June).
The number of part-time workers was little changed in July at 4.6 million but declined by 669,000 over the past year. The number of long-term unemployed (more than 27 weeks) also was unchanged at 1.4 million. This group accounts for 22.7 percent of all unemployed.
Retail trade changed little with an increase of 7,000 jobs; those gains were essentially wiped out by the decline of 32,000 jobs in sporting goods, hobby, book and music stores. Manufacturing continues to grow although it is far from pre-recession levels. (See chart.)
Manufacturing grew in the transportation equipment subsector (+13,000), machinery (+6,000) and electronic instruments (+2,000). Manufacturing has not recovered the jobs lost after the onset of the Great Recession. It is unclear how the pending trade and tariff wars will play out in the job market over the next few months. Opinions are varied. "While the ongoing trade dispute may discourage businesses to invest and hire down the road, today's jobs report suggests the jobs market is not yet collateral damage," said Beth Ann Bovino, chief U.S. economist at S&P Global Ratings in New York.
- The unemployment rate declined to 3.9 percent in July with payrolls expanding by 157,000 jobs, according to the Bureau of Labor Statistics.
- The Labor Force Participation (LFP) remained at 62.9 percent. The employment-population ratio rose in July to 60.5 percent; it has increased by 0.3 percentage point over the year. The number of unemployed for the month was 6.3 million. Since last year 676,000 persons left the status of unemployment.
- In July employment grew in the manufacturing, health care, construction and professional services.
- Manufacturing added 37,000 jobs with durable goods manufacturing accounting for most of the gain. Over the past year manufacturing has added 327,000 jobs.
- Professional and business services added 51,000 jobs. This sector has added 518,000 jobs over the past year.
- Employment in the other major sectors—mining, wholesale trade, transportation and warehousing, information, financial activities, and government —changed little over the month.
- Over the year, average hourly earnings have increased by 71 cents or 2.7 percent.
- Among major worker groups he jobs rates remained unchanged except for adult men and Whites.

ANALYSIS
The U.S. economy added 157,000 jobs failing to meet the consensus figure of 190,000. However, the report looks even better when considering the moving three-month average of 224,000. That’s because figures for the previous two-months were revised upward (+244,000 to +268,000 for May and +213,000 to +248,000 for June).
The number of part-time workers was little changed in July at 4.6 million but declined by 669,000 over the past year. The number of long-term unemployed (more than 27 weeks) also was unchanged at 1.4 million. This group accounts for 22.7 percent of all unemployed.
Retail trade changed little with an increase of 7,000 jobs; those gains were essentially wiped out by the decline of 32,000 jobs in sporting goods, hobby, book and music stores. Manufacturing continues to grow although it is far from pre-recession levels. (See chart.)
Manufacturing grew in the transportation equipment subsector (+13,000), machinery (+6,000) and electronic instruments (+2,000). Manufacturing has not recovered the jobs lost after the onset of the Great Recession. It is unclear how the pending trade and tariff wars will play out in the job market over the next few months. Opinions are varied. "While the ongoing trade dispute may discourage businesses to invest and hire down the road, today's jobs report suggests the jobs market is not yet collateral damage," said Beth Ann Bovino, chief U.S. economist at S&P Global Ratings in New York.
Friday, July 27, 2018
Thursday, July 26, 2018
MA Domestic Product State for 1st Quarter 2018: +1.5%; GDP-S: $542.2b
OVERVIEW


- Real gross domestic product (GDP) state increased in 48 states and the District of Columbia in the first quarter of 2018, according to statistics on the geographic breakout of GDP released by the U.S. Bureau of Economic Analysis.
- Real GDP by state growth in the first quarter ranged from 3.6 percent in Washington to -0.6 in North Dakota. See Chart 1 from the BEA.
- The Massachusetts economy grew by 1.5 percent in the first quarter of 2018. This was below the 1.8 national average of all states and the District of Columbia. It ranked 29th in first quarter growth, nationally.
- As a region, the six states of New England grew by 1.5 percent, less than the average of all states (1.8 percent). The Southwest — Texas, New Mexico, Arizona and Oklahoma — grew the largest for Qtr1-2018 at 2.7 as did the Rocky Mountain region --Colorado, Idaho, Montana, Utah and Wyoming.
- The current dollar size of the Massachusetts GDP by State is $542.2 billion and contributes 2.7 percent of the nation’s GDP.
- Durable Goods Manufacturing increased 3.2 percent nationally. This is the eighth consecutive quarter of growth for the sector. In Massachusetts, Durable and Non-durable Goods manufacturing contributed 0.17 and 0.13 percentage points to the change in GDP-S, respectively.

ANALYSIS
Gross Domestic Product State (GDP-S) is the market value of goods and services produced by labor and property (or capital) in a state. The sum of GDP for all states released this week (1.8 percent for Qtr1-2018) differs from the headline number for national GDP (Qtr1-2018: 2.0 percent) since outputs like military and overseas activity can’t be attributed to any one state.
Real Estate and Rental and Leasing along with Information sectors were the leading contributors to the increase in real GDP nationally.
In Massachusetts, Real Estate and Rental and Leasing; Information and Professional, Scientific, & Technical Services were the major contributors to the 1.5 percent growth in Qtr1-2018. (See Table 1 p. 2.) Of these sectors, only the Information sector lost jobs (down 1,100) over a year ago. Meanwhile, Real Estate, Rental and Leasing and Professional Services added, 2,200 and 26,700 new jobs, respectively.
Thus far, the state’s economy has lagged the 2.6 percent change in growth it saw for 2017. Last year, the state experienced two stellar quarters of growth Qtr1-2017 at 5.1 and Qtr3-2017 at 5.2.
In the most recent survey, Massachusetts growth lags expansions in other high technology states. How do other high-tech states compare with Massachusetts? The state of Washington grew by 3.6 percent the fastest in the nation, Virginia by 2.4 percent while the Utah economy grew by 3.2 percent. Meanwhile, California slowed to 1.5 percent, Colorado by 3.0 percent; North Carolina grew by 2.1 percent as Minnesota expanded by 1.6 percent.


Tuesday, July 24, 2018
Monday, July 23, 2018

The threat of automation, another paper on the topic
A new NBER Working Paper by David E. Bloom, Mathew McKenna, Klaus Prettner "Demography, Unemployment, Automation, and Digitalization: Implications for the Creation of (Decent) Jobs, 2010-2030"
Abstract:
Globally, an estimated 734 million jobs will be required between 2010 and 2030 to accommodate recent and ongoing demographic shifts, account for plausible changes in labour force participation rates, and achieve target unemployment rates of at or below 4 percent for adults and at or below 8 percent for youth. The facts that i) most new jobs will be required in countries where "decent" jobs are less prevalent and ii) workers in many occupations are increasingly subject to risks of automation further compound the challenge of job creation, which is already quite sizable in historical perspective. Failure to create the jobs that are needed through 2030 would put currently operative social security systems under pressure and undermine efforts to guarantee the national social protection floors enshrined in the Sustainable Development Goals (SDGs).
Paper available for NBER members.
Subscribe to:
Posts (Atom)