
Friday, January 11, 2019
Wednesday, January 9, 2019

Sunday, January 6, 2019
How the Job Market of 2018 Stacks Up: Real Time Economics - Wall Street Journal

WSJ:
Wages rose 3.2%, both hourly and weekly. That's not quite as strong as some of the year-over-year readings earlier this year, but it's the best number to close the year in over a decade.

Wednesday, January 2, 2019
Friday, December 28, 2018
The Economics and Politics of Revoking NAFTA
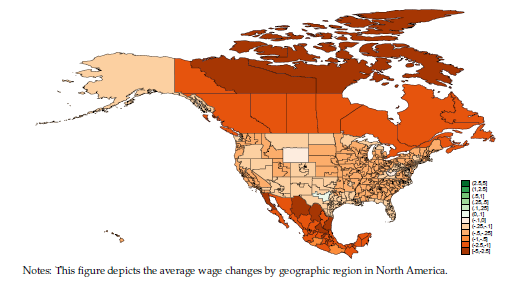
From a new NBER working paper by Raphael Auer, Barthélémy Bonadio, and Andrei A. Levchenko
We provide a quantitative assessment of both the aggregate and the distributional effects of revoking NAFTA using a multi-country, multi-sector, multi-factor model of world production and trade with global input-output linkages. Revoking NAFTA would reduce US welfare by about 0.2%, and Canadian and Mexican welfare by about 2%. The distributional impacts of revoking NAFTA across workers in different sectors are an order of magnitude larger in all three countries, ranging from -2.7 to 2.26% in the United States. We combine the quantitative results with information on the geographic distribution of sectoral employment, and compute average real wage changes in each US congressional district, Mexican state, and Canadian province. We then examine the political correlates of the economic effects. Congressional district-level real wage changes are negatively correlated with the Trump vote share in 2016: districts that voted more for Trump would on average experience greater real wage reductions if NAFTA is revoked.
Gated version here.
Thursday, December 27, 2018

Wednesday, December 26, 2018
The November 2018 Employment Situation in Massachusetts
U-Rate: 3.4%; +4,600; +60,500 YoY
OVERVIEW- According to the Executive Office of Labor and Workforce Development, the state’s total unemployment rate dropped one-tenth of a percentage point to 3.4 percent in November.
- According to the federal Bureau of Labor Statistics, the state added 4,600 jobs in November.
- he state’s unemployment rate was three-tenths of a percentage point lower than the national average of 3.7 percent.
- The state’s Labor Force Participation Rate (LFP) remained at 68.0 percent. Since November 2017, the LFP rate by 2.7 percentage points.
- Trade, Transportation and Utilities added 3,100 over the month and Professional, Scientific and Business Services added 1,700 with Education and Health Services adding 1,200.
- Financial Activities lost 700 jobs over the month with Construction (-500), Other Services (-300) and Manufacturing (-100) also losing jobs in November.
- Two sectors remained unchanged over the month: Government and Leisure and Hospitality.

ANALYSIS
Since January the Massachusetts monthly unemployment rate averaged 3.5 percent. The state continues to enjoy an unemployment rate less than the national rate.
The jobs economy is driven mostly by the state’s Professional, Scientific and Business Services sector, which created 27,600 jobs since last November. However, the Leisure and Hospitality sector shed 800 jobs since that time. Financial Activities only added 700 jobs. Government has lost jobs.
Education and Health Services comprise the largest sector in Massachusetts. (See table above) Over the past 12 months it has added 14,400 jobs.
Assuming the BLS figure of 60,500 new jobs, the state created a monthly average of approximately 5,000 jobs since last November. Northern New England is benefiting from low unemployment rates.

Thursday, December 20, 2018
Wednesday, December 19, 2018
Tuesday, December 18, 2018
Saturday, December 8, 2018
Monday, December 3, 2018
Sunday, December 2, 2018

Sunday, November 25, 2018
Saturday, November 24, 2018

Tax Foundation's International Tax Competitiveness Index
h

From the Tax Foundation:
The structure of a country’s tax code is an important determinant of its economic performance. A well-structured tax code is easy for taxpayers to comply with and can promote economic development while raising sufficient revenue for a government’s priorities. In contrast, poorly structured tax systems can be costly, distort economic decision-making, and harm domestic economies.
Read more here.
Under construction: Local economy East Boston, Ward 1-Boston, 02128
BUSINESS DEVELOPMENT
#DBA New Certificates issued
10 for November 2017
EMPLOYMENT DATA
State Unemployment Rate (MA)
3.7% October 2017
U.S. Unemployment Rate
4.1% October 2017
Metro Boston Unemployment Rate*
3.3% September 2017
State and Area Employment (000s)
3,643 October 2017
Jobs Added MA YoY
69,000 October 2017
Suffolk County Unemployment# & Rate 13,410; 3.1% October 17 NSA
Boston Unemployment Rates
3.1% October 2016
U.S Productivity: 3.0% 3rd Qtr. 2017 est.
Suffolk County Avg. Wkly Wage
$2,016 (1st Qtr 2017)
Occupational Employment and Wage Estimates (Boston Metro 5/2016)
$32.66 (avg. hr)
$67,930 (avg. annual salary.)
HOUSING
Housing Permits (MA): 1568
October 2017
Massachusetts Homeownership Rate
59.7% (2016)
Change in FHFA State House Price Indexes
(Seasonally Adjusted, Purchase-Only Index, 2017Q2:1.96)
CONSUMER
U.S. CPI-U, All items, 12-month % change*
0.1% (10/2017 over 10/2016) All Items YoY: +2.0%
Boston Metro Consumer Price Index
2.7% (9/2017 over 9/2016)
ENERGY
Boston Average Price - Gasoline, Unleaded Reg., Per Gallon/ 2.560 October 2017
Massachusetts Average Price Heating Oil
$2.877 per gallon 11/27/17 (excl. taxes)
Stock Market: Local:
East Boston Savings Bank Stock Latest
Bloomberg MA Stock Index (BCMAX:IND)
#DBA New Certificates issued
10 for November 2017
EMPLOYMENT DATA
State Unemployment Rate (MA)
3.7% October 2017
U.S. Unemployment Rate
4.1% October 2017
Metro Boston Unemployment Rate*
3.3% September 2017
State and Area Employment (000s)
3,643 October 2017
Jobs Added MA YoY
69,000 October 2017
Suffolk County Unemployment# & Rate 13,410; 3.1% October 17 NSA
Boston Unemployment Rates
3.1% October 2016
U.S Productivity: 3.0% 3rd Qtr. 2017 est.
Suffolk County Avg. Wkly Wage
$2,016 (1st Qtr 2017)
Occupational Employment and Wage Estimates (Boston Metro 5/2016)
$32.66 (avg. hr)
$67,930 (avg. annual salary.)
HOUSING
Housing Permits (MA): 1568
October 2017
Massachusetts Homeownership Rate
59.7% (2016)
Change in FHFA State House Price Indexes
(Seasonally Adjusted, Purchase-Only Index, 2017Q2:1.96)
CONSUMER
U.S. CPI-U, All items, 12-month % change*
0.1% (10/2017 over 10/2016) All Items YoY: +2.0%
Boston Metro Consumer Price Index
2.7% (9/2017 over 9/2016)
ENERGY
Boston Average Price - Gasoline, Unleaded Reg., Per Gallon/ 2.560 October 2017
Massachusetts Average Price Heating Oil
$2.877 per gallon 11/27/17 (excl. taxes)
Stock Market: Local:
East Boston Savings Bank Stock Latest
Bloomberg MA Stock Index (BCMAX:IND)
Friday, November 23, 2018
Saturday, November 17, 2018
The Massachusetts Employment Situation: U-Rate 3.5%; Jobs 4,400; 64,400 YoY
OVERVIEW
- According
to the Executive Office of Labor and Workforce Development, the state’s
total unemployment rate dropped one-tenth of a percentage point to 3.5 percent
in October.
- According to the federal
Bureau of Labor Statistics, the state also added 4,400 jobs in October.
- The state’s unemployment rate was two-tenths of
a percentage point lower than the national average of 3.7 percent.
- The state’s Labor Force Participation Rate (LFP)
continued to improve since October 2017. It now stands at 68.0 percent, an
increase of 2.6 percentage points. October estimates show 3.69 million
residents were employed in Massachusetts.
- The largest private sector percentage job gains over the past year took place in the
Construction (+5.4); Professional, Scientific and Business Services (+5.1);
Information (+2.0); and Education and Health Services (+1.9).
- Meanwhile, Financial Activities; Leisure and Hospitality each lost 400 jobs while Government lost 300 jobs.
ANALYSIS
The Massachusetts economy steamrolls ahead. By adding 4,400 jobs, the state’s economy showed no signs of slowing down.
"The Massachusetts unemployment rate continues to remain low at 3.5 percent and has now held below 4 percent for 30 consecutive months. With the Commonwealth's consistently low rate of unemployment, the economy continues to add jobs at a healthy clip and our labor force continues to grow to meet employment needs," Labor and Workforce Development Secretary Rosalin Acosta said.
The job market is so attractive that the October labor force increased by 10,800. Employers are competing for talent.
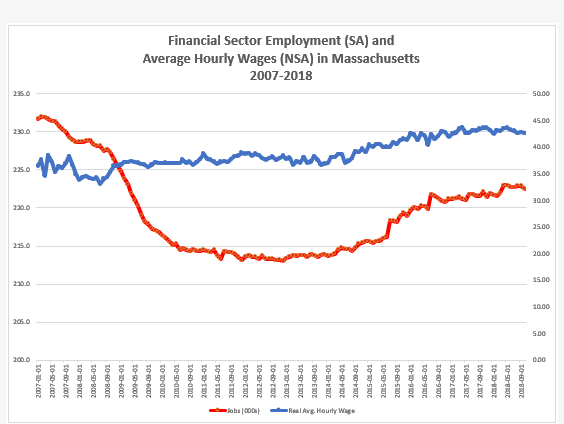
Consolidation in the state’s financial sector has been gradual. The state’s financial sector has not appreciably grown as the economy recovered from the Great Recession.
In February 2007, 10 months before the recession began, the sector employed 232,000 workers; today it employs 222,000 workers on a seasonally adjusted basis.
However, wages in the sector have increased in real terms. The average hourly wage for financial workers in January 2007 was $36.45 compared to today’s average hourly wage of $42.55. The ascent in wages picked up slightly in July 2007 as jobs in the sector began to recover.
As defined by the BLS, the financial sector classification includes finance, insurance, real estate, rental and leasing subsectors.
Friday, November 16, 2018

Thursday, November 15, 2018

Saturday, November 10, 2018
Tuesday, November 6, 2018
Monday, November 5, 2018
WalletHub: Boston ranks second best city for STEM professionals
From the Daily Free Press:
Boston is the second best metro area in the nation for STEM (science, technology, engineering and math) professionals to live, according to a recent report by WalletHub, a personal finance website.
Seattle, Washington, came first in the rankings, which were based on 17 metrics which evaluated three general categories: professional opportunities, friendliness to the STEM fields and quality of life for residents.Read more here.
Friday, November 2, 2018
Notes on today's U.S. jobs report: A 3.7% unemployment rate and 250,000 new jobs
OVERVIEW

- The unemployment rate remained at 3.7 percent in October with payrolls expanding by 250,000 jobs, according to the Bureau of Labor Statistics.
- According to the BLS, Hurricane Michael, which fell while the agency collected data, had no noticeable effect on job estimates.
- The Labor Force Participation (LFP) rose 0.02 to 62.9 percent. The Employment-population ratio also finished up for the month at 60.6 percent. The number of unemployed for the month was 6.1 million representing a decline over the year of 449,000 persons.
- Job gains took place in, Health care (+36,000), Manufacturing (+32,000), Construction (+30,000) Professional and business services (+35,000) and the Transportation and warehousing sector (+25,000).
- Mining grew by 5,000 jobs in October while Leisure and hospitality gained 42,000 withstanding the impact of Hurricane Florence. While employment was unchanged in this sector, the two-month growth matched the 12-month average at 21,000 per month.
- In addition, according to the BLS, the following sectors saw little or no change in employment: Wholesale trade, Retail trade, Information, Financial activities and Government.
- Over the year, average hourly earnings have increased by 83 cents or 3.1 percent. In October, the average hourly private non-farm wage rang in at $27.30, an increase of five cents. The average workweek for all employees clocked in at 34.5 hours.
- The number of persons employed part-time for economic reasons was unchanged at 4.6 million. The number of long-term unemployed also changed little at 1.4 million. This group represents 22.5 percent of all unemployed persons.

ANALYSIS
Total nonfarm payroll employment rose by 250,000 in October. Not knowing how to gauge weather interruptions from last month, Wall Street forecasts provided a wide range of payroll increases between 105.000 to 253,000 jobs.
The BLS revised numbers for September downward (from 134,000 to 118,000) and upward for August (from 270,000 to 286,000). These revised figures show that job gains have averaged 218,000 over the past three months.
The BLS reported 246,000 new private sector jobs were created compared with the ADP payrolls report released earlier this week of 227,000 private payrolls.
The continued growth in the manufacturing sector emerged as one of the highlights on today’s report. The sector has added 296,000 jobs over the past year— most of it coming from durable goods production. Here, in this sector, the workweek remained steady at 40.8 hours.
While the economy is at full employment, worker productivity is lagging. Output, the amount produced by workers, has been sluggish. At 1.3 percent in the most recent measure, productivity has failed to surpass 2 percent for the last 32 quarters. Nearly two decades ago, productivity gains fell regularly in the 3 percent range.
According to the Wall Street Journal, Chicago Fed President Charles Evans noted the importance of productivity to the nation’s long-term growth in speech earlier this year. “Higher sustainable growth would be great. However, we can’t get there without boosting the underlying trends in labor input or productivity,” Mr. Evans said.
Manufacturing sector labor productivity increased 0.5 percent in the third quarter, according the third quarter report released earlier this week. There’s some good news for workers: Average hourly earnings have recovered from the Great Recession but still below the 2008 pre-recession peak. Labor force participation, which has languished as a result of the retiring baby-boom workers inched up by 0.2 percentage point over the year. These two trends point to mounting pressures on the Federal Reserve Bank to stick to its plan to raise interest rates through 2019.
Thursday, November 1, 2018

Subscribe to:
Posts (Atom)